Spread by Hour and Spread vs Entries
What it is
Spread is usually the largest trading cost for short-term strategies, and it is not constant. It widens around session opens, around news, and most of all around the daily rollover. These two charts show how much spread your strategy paid at each hour of the day, and whether it is entering when spread is high.
- Spread vs Entries shows the spread your trades actually paid, by the hour they were entered, next to how many trades were entered in each hour.
- Spread by Hour shows the spread the market quoted on every bar, by hour, whether or not the strategy traded then.
The first tells you what your trades cost. The second tells you what you could have paid instead.
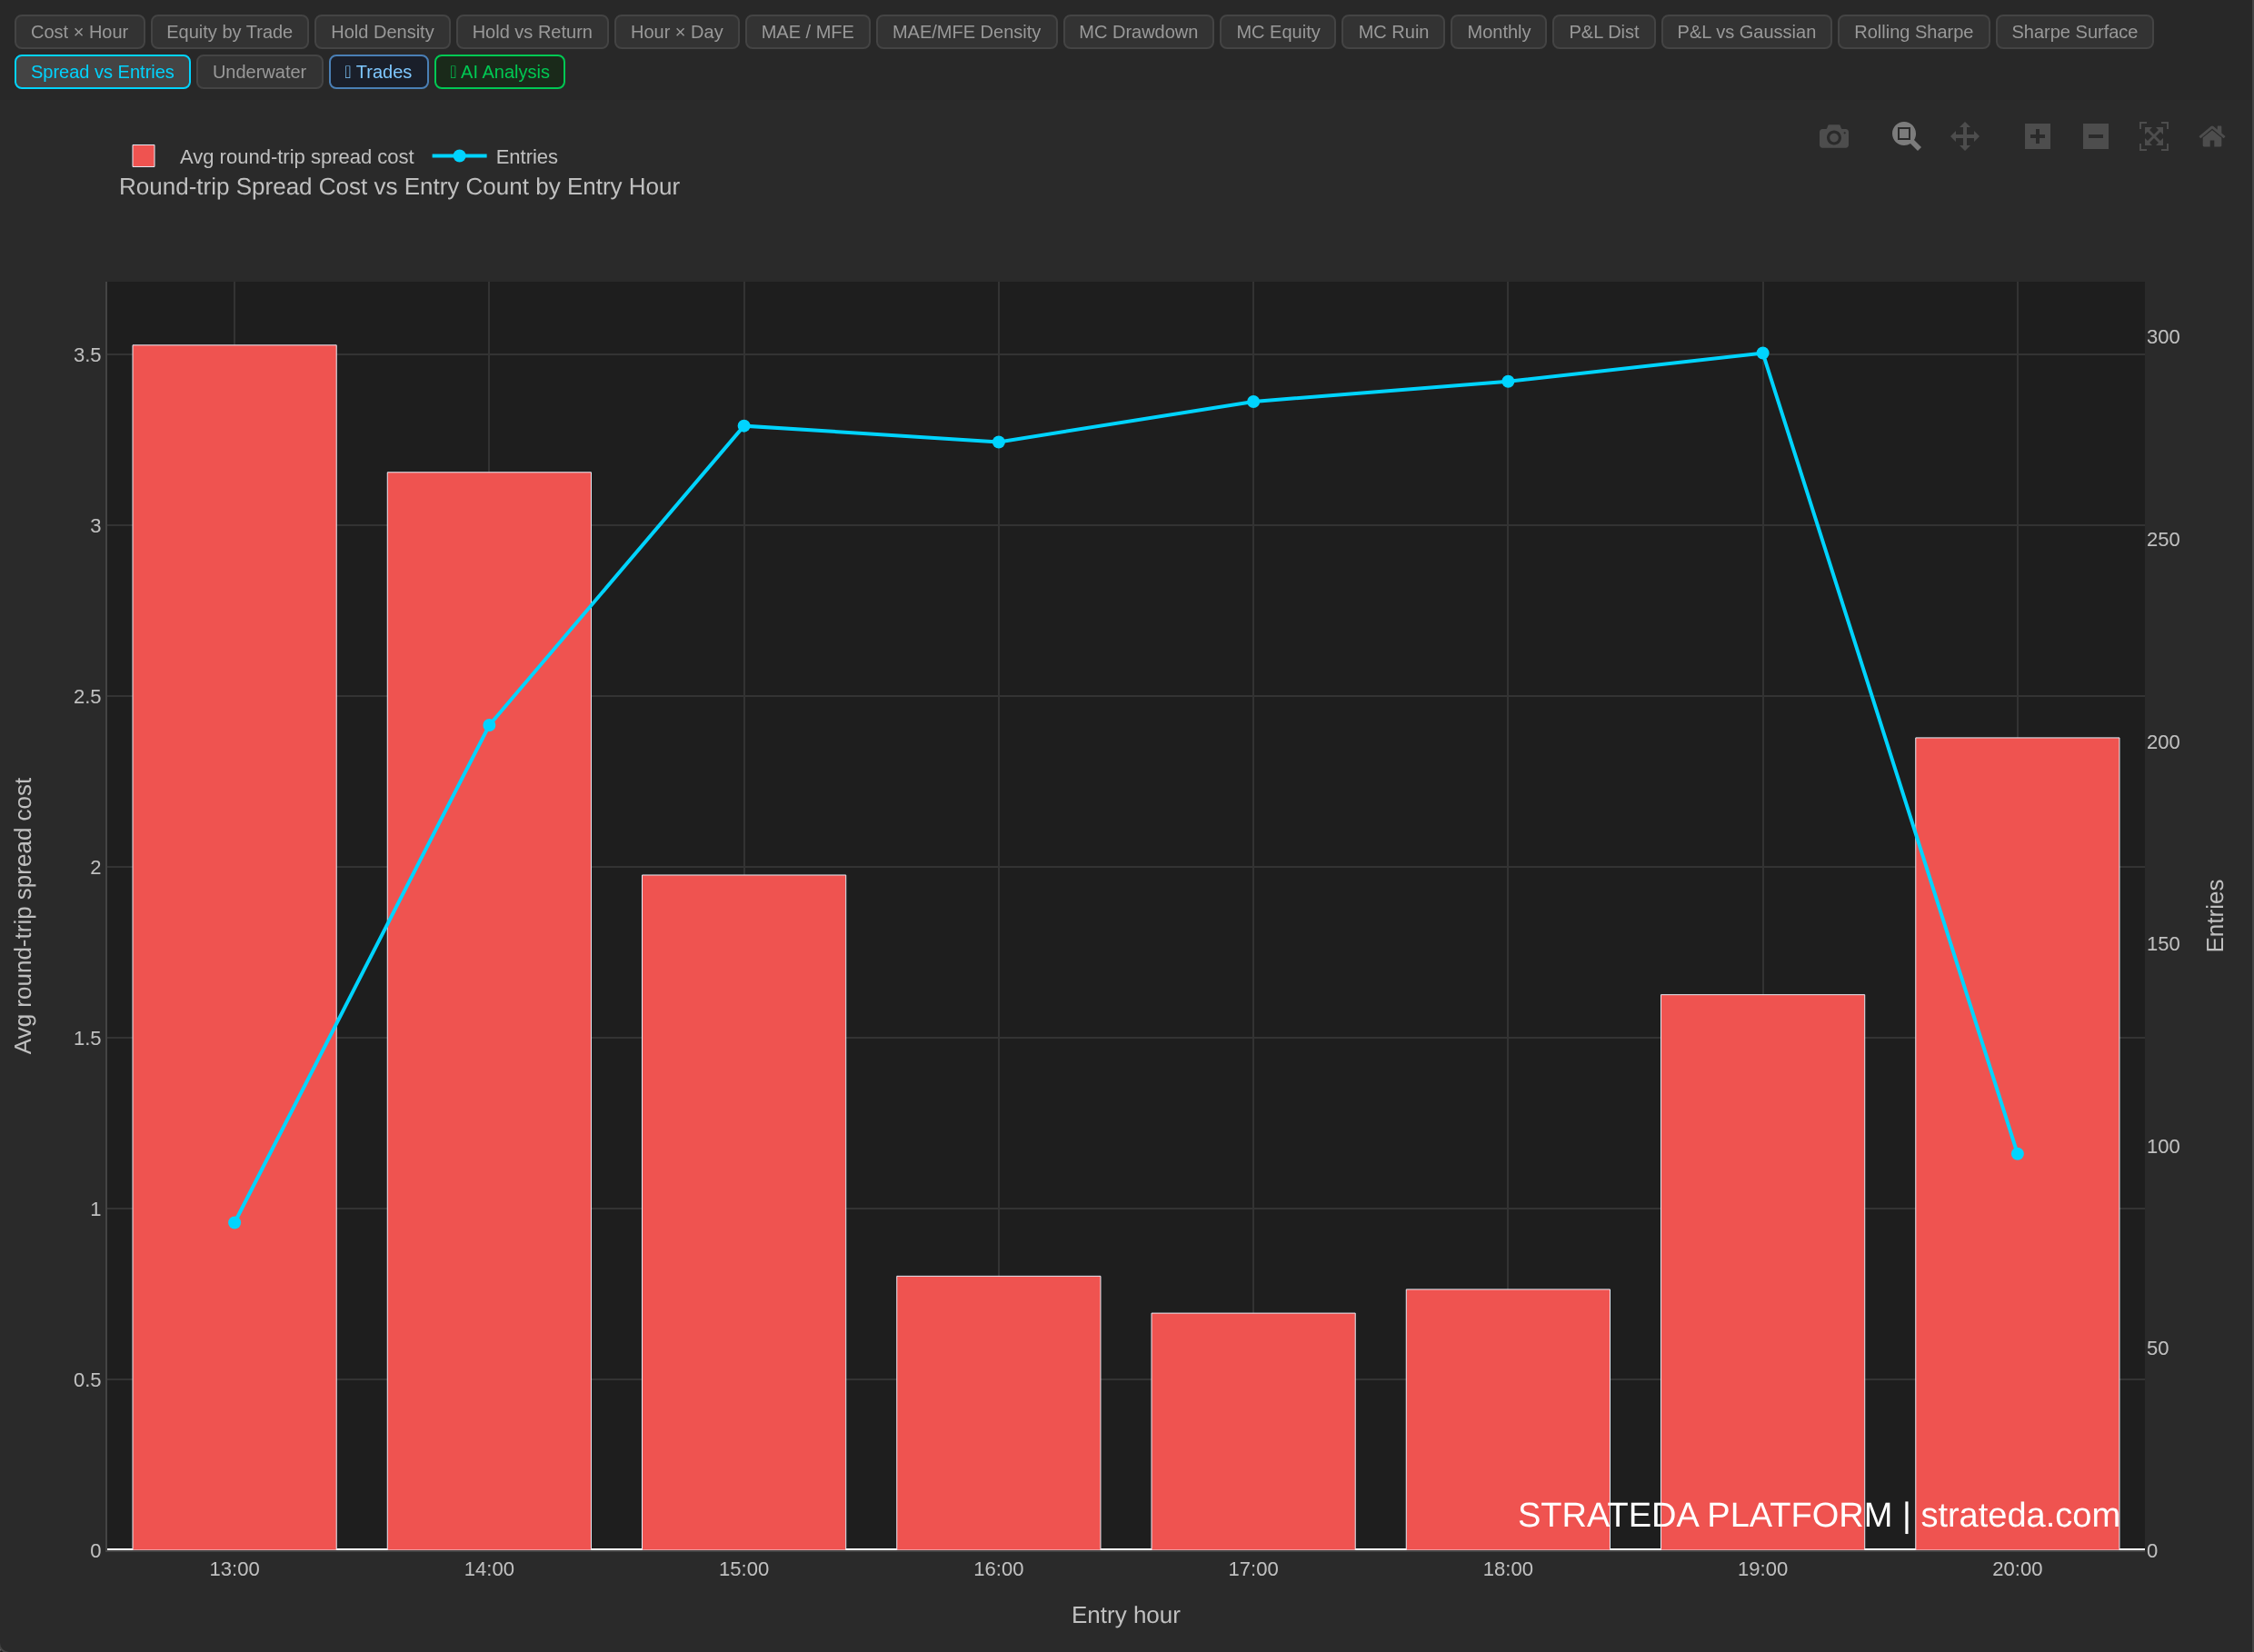
AAPL M1, 1,804 trades. The most expensive hour (13:00 UTC, the US open) is where this strategy enters least, about 80 times, while most entries fall between 15:00 and 19:00 at a fraction of the cost. The cost peak and the entry peak do not coincide, so most trades avoid the costliest hour.
How to access it
Both are tabs in the Strategy Analytics panel after a backtest: Spread vs Entries and Spread by Hour. Available on Plus and above.
- Spread vs Entries appears when the backtest recorded the spread paid per trade.
- Spread by Hour appears only when the price data carries a spread for every bar. This is the case for US Stocks and CME futures data. It is not available for MT5 data. For MT5 runs, use Spread vs Entries.
What you see
Spread vs Entries
- X-axis: Entry hour. Every hour between the first and last traded hour is shown, so a gap in the strategy's trading stays visible.
- Red bars (left axis): Average round-trip spread cost per trade entered in that hour.
- Cyan line (right axis): Number of trades entered in that hour.
Spread by Hour
- X-axis: Bar hour (UTC), covering all hours in the data, including hours the strategy never traded.
- Red bars (left axis): Average quoted spread per bar in that hour.
- Cyan line (right axis): Number of entries in that hour, when the backtest has trades.
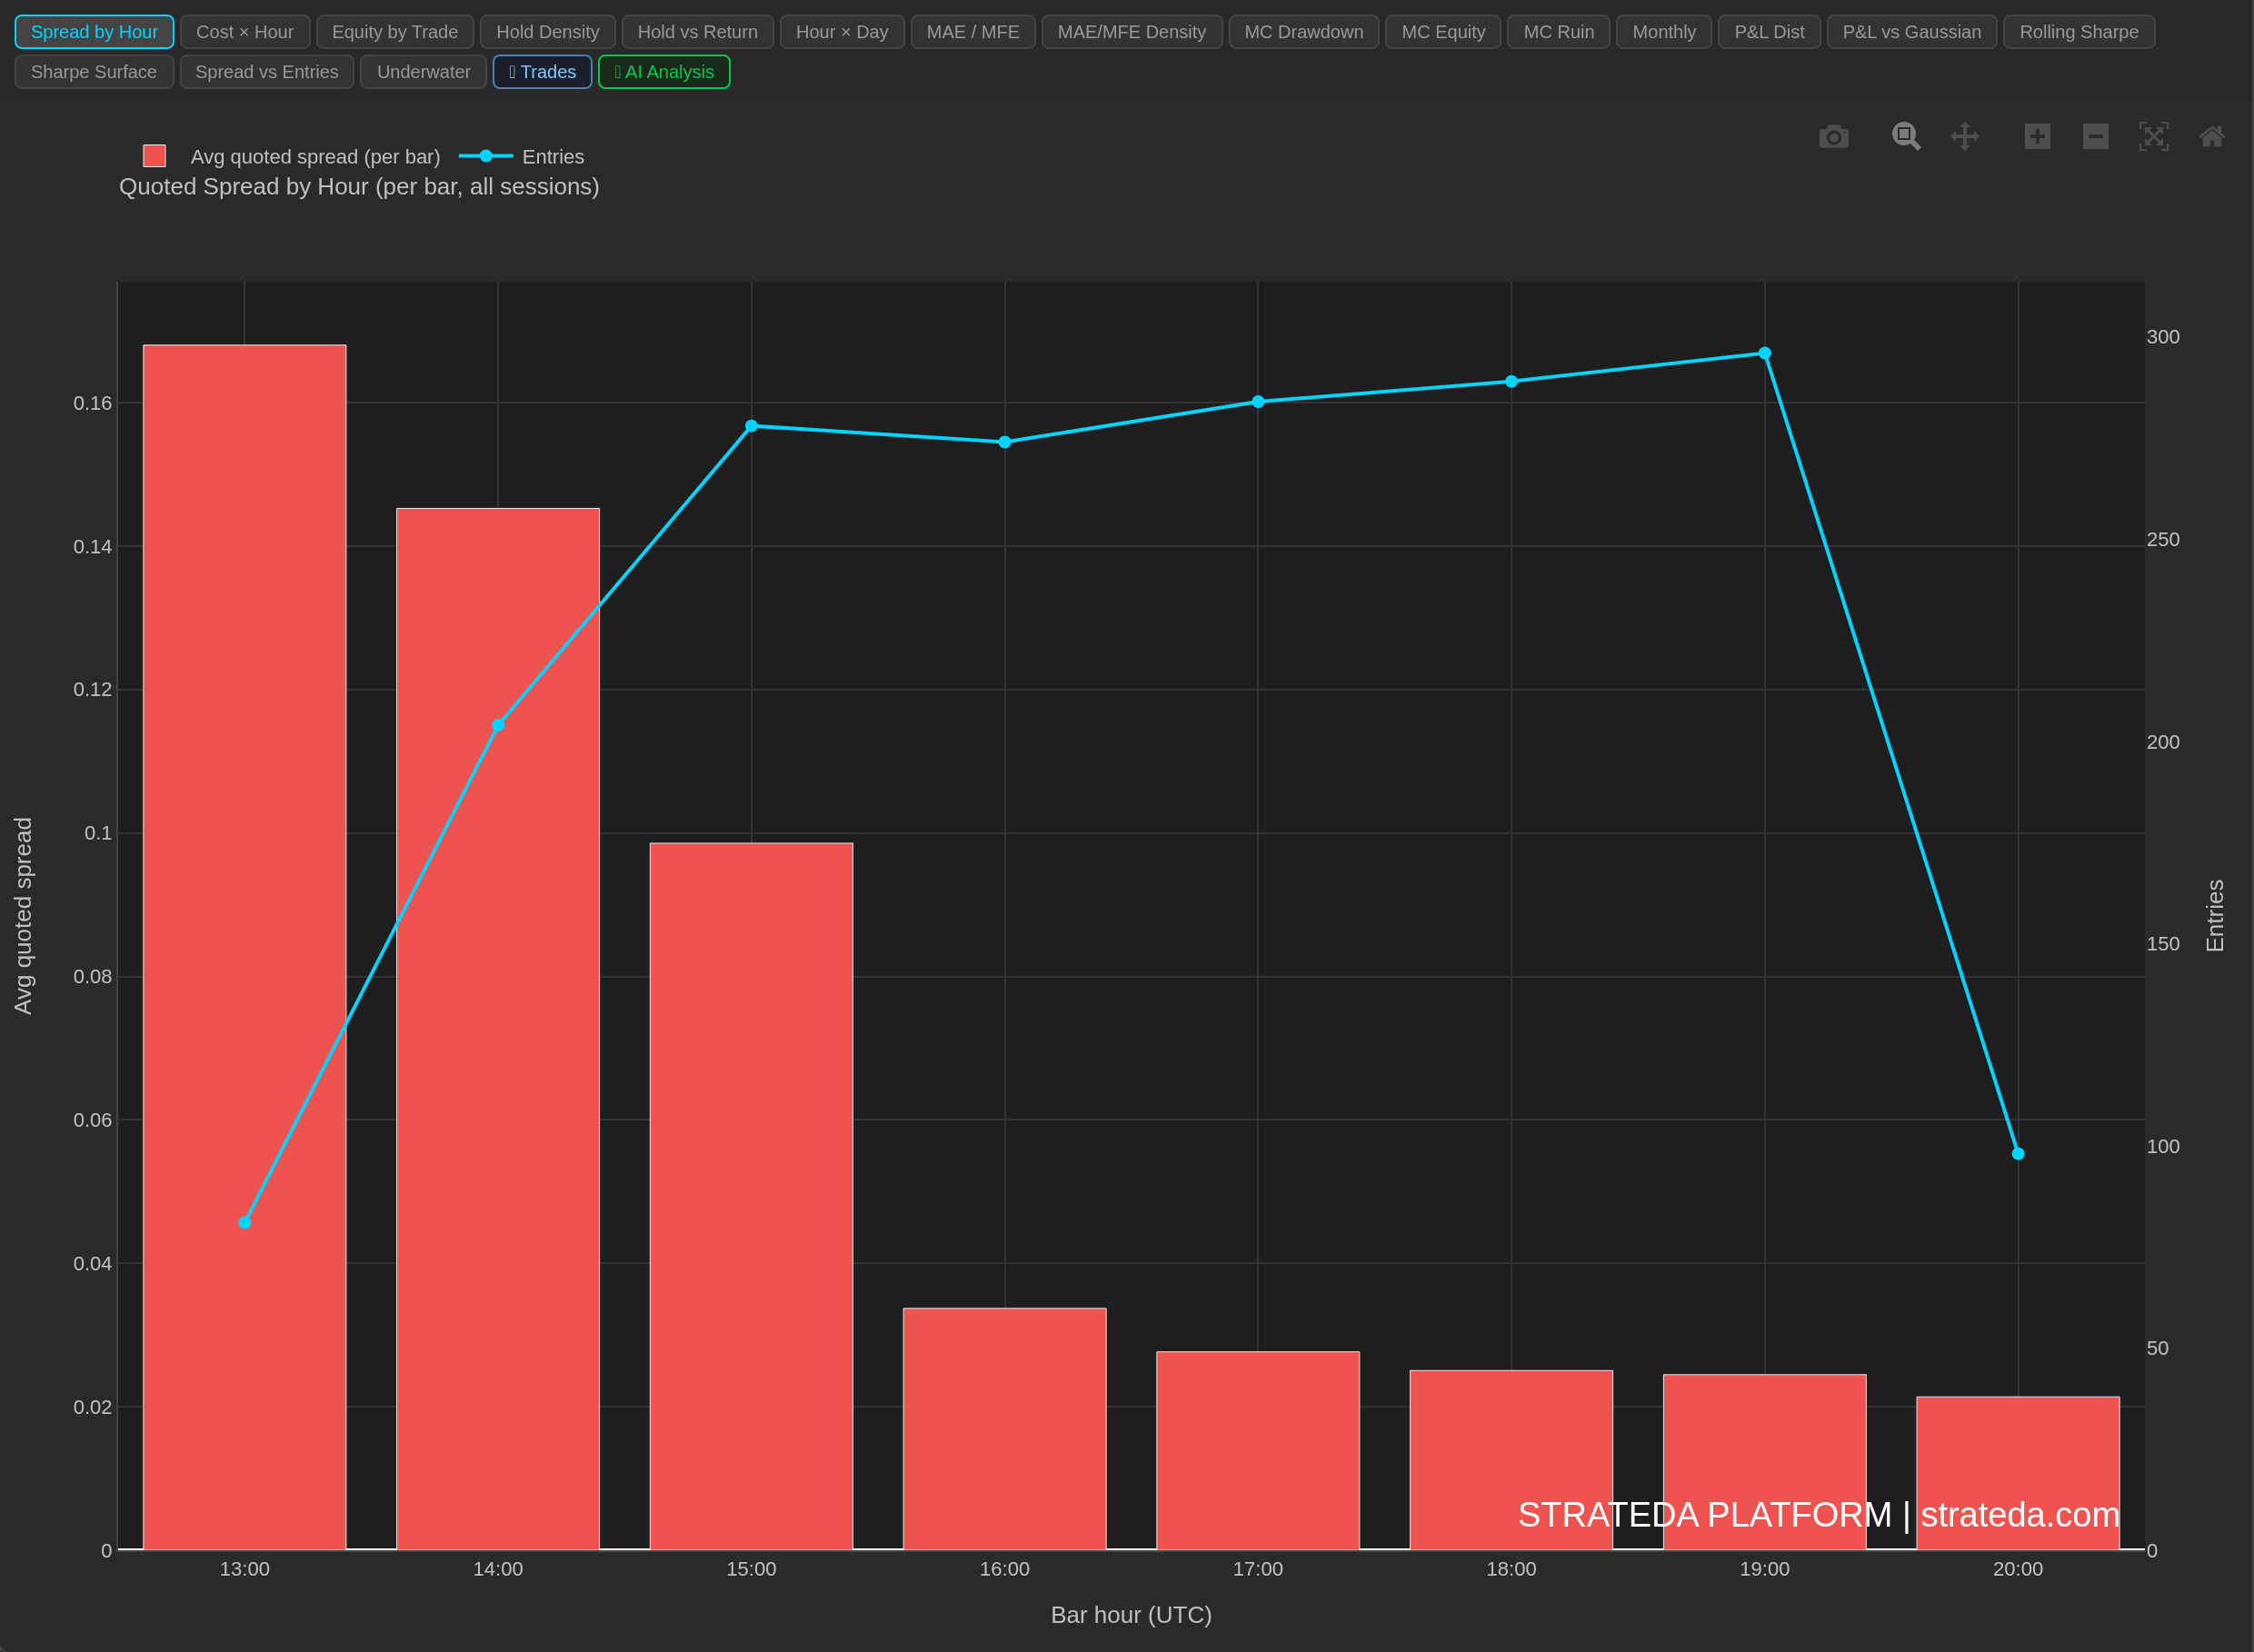
The same AAPL M1 run. The quoted spread in the opening hour (13:00 UTC) averages about 0.17 per bar, roughly eight times the 0.02 quoted near the close. Only 81 of the 1,804 entries fall in that hour, so the strategy mostly avoids the widest spread of the day.
How to interpret it
The question to ask: am I entering where spread is highest?
The warning sign in Spread vs Entries is the tallest cost bar and the tallest entry-count line peaking at the same hour. Then the strategy pays the worst spread on most of its trades.
Why the two charts show different heights
Spread vs Entries understates an entry spike. Each trade is charged spread once per round trip, and the chart files that charge under the hour the trade was entered. In MT5 mode the charge is the average of the spread on the entry bar and on the exit bar: a trade entered at the rollover and closed an hour later averages the wide spread with a normal one, so the bar shows roughly half the spike. A cheap exit hides an expensive entry. In Non-MT5 mode the charge is a single bar's spread, the bar on which the exit was triggered, times the position size (or the Spread Override value instead of the bar's spread), so the entry bar's spread is not in it at all. Hours with no entries between the first and last traded hour are shown empty; hours outside that span are not shown.
Spread by Hour shows the spike at full height. It is the quoted spread on each bar, not an average of two, and it covers every hour. That contrast is its purpose: it shows how much cheaper the hours next to your entry hour would have been.
Typical patterns
One tall bar at the daily rollover: expected for most FX, metals and CFD instruments. Harmless if the strategy rarely enters there; expensive if it often does.
Higher spread outside the instrument's main session: for example, US equity index futures overnight. A strategy trading those hours pays for thin liquidity.
A flat profile: spread cost does not depend on timing. Shifting the trading window will not reduce it.
Example
A EURCHF M5 strategy shows its tallest red bar at 21:00 in Spread vs Entries, and its entry-count line peaks in the same hour, with 52 of 81 entries. The two peaks coinciding means the strategy enters most often exactly when spread is widest.
On data with a per-bar spread, the Spread by Hour chart would show the 21:00 bar standing far above every other hour, because it is not diluted by a cheaper exit. Together with the Cost × Hour heatmap, this points to one experiment: exclude the rollover hour from the strategy's trading hours and re-run the backtest.