Hold Time vs Return
What it is
Hold Time vs Return maps the duration of each trade (how long the position was open) against its P&L outcome. This reveals whether your strategy benefits from holding longer, whether quick trades are more profitable than extended ones, and whether there's an optimal holding period. It's a diagnostic for trade management — are you exiting too early, too late, or at the right time?
How to access it
Navigate to the Hold vs Return tab in the performance dashboard. Available on Plus and above.
What you see
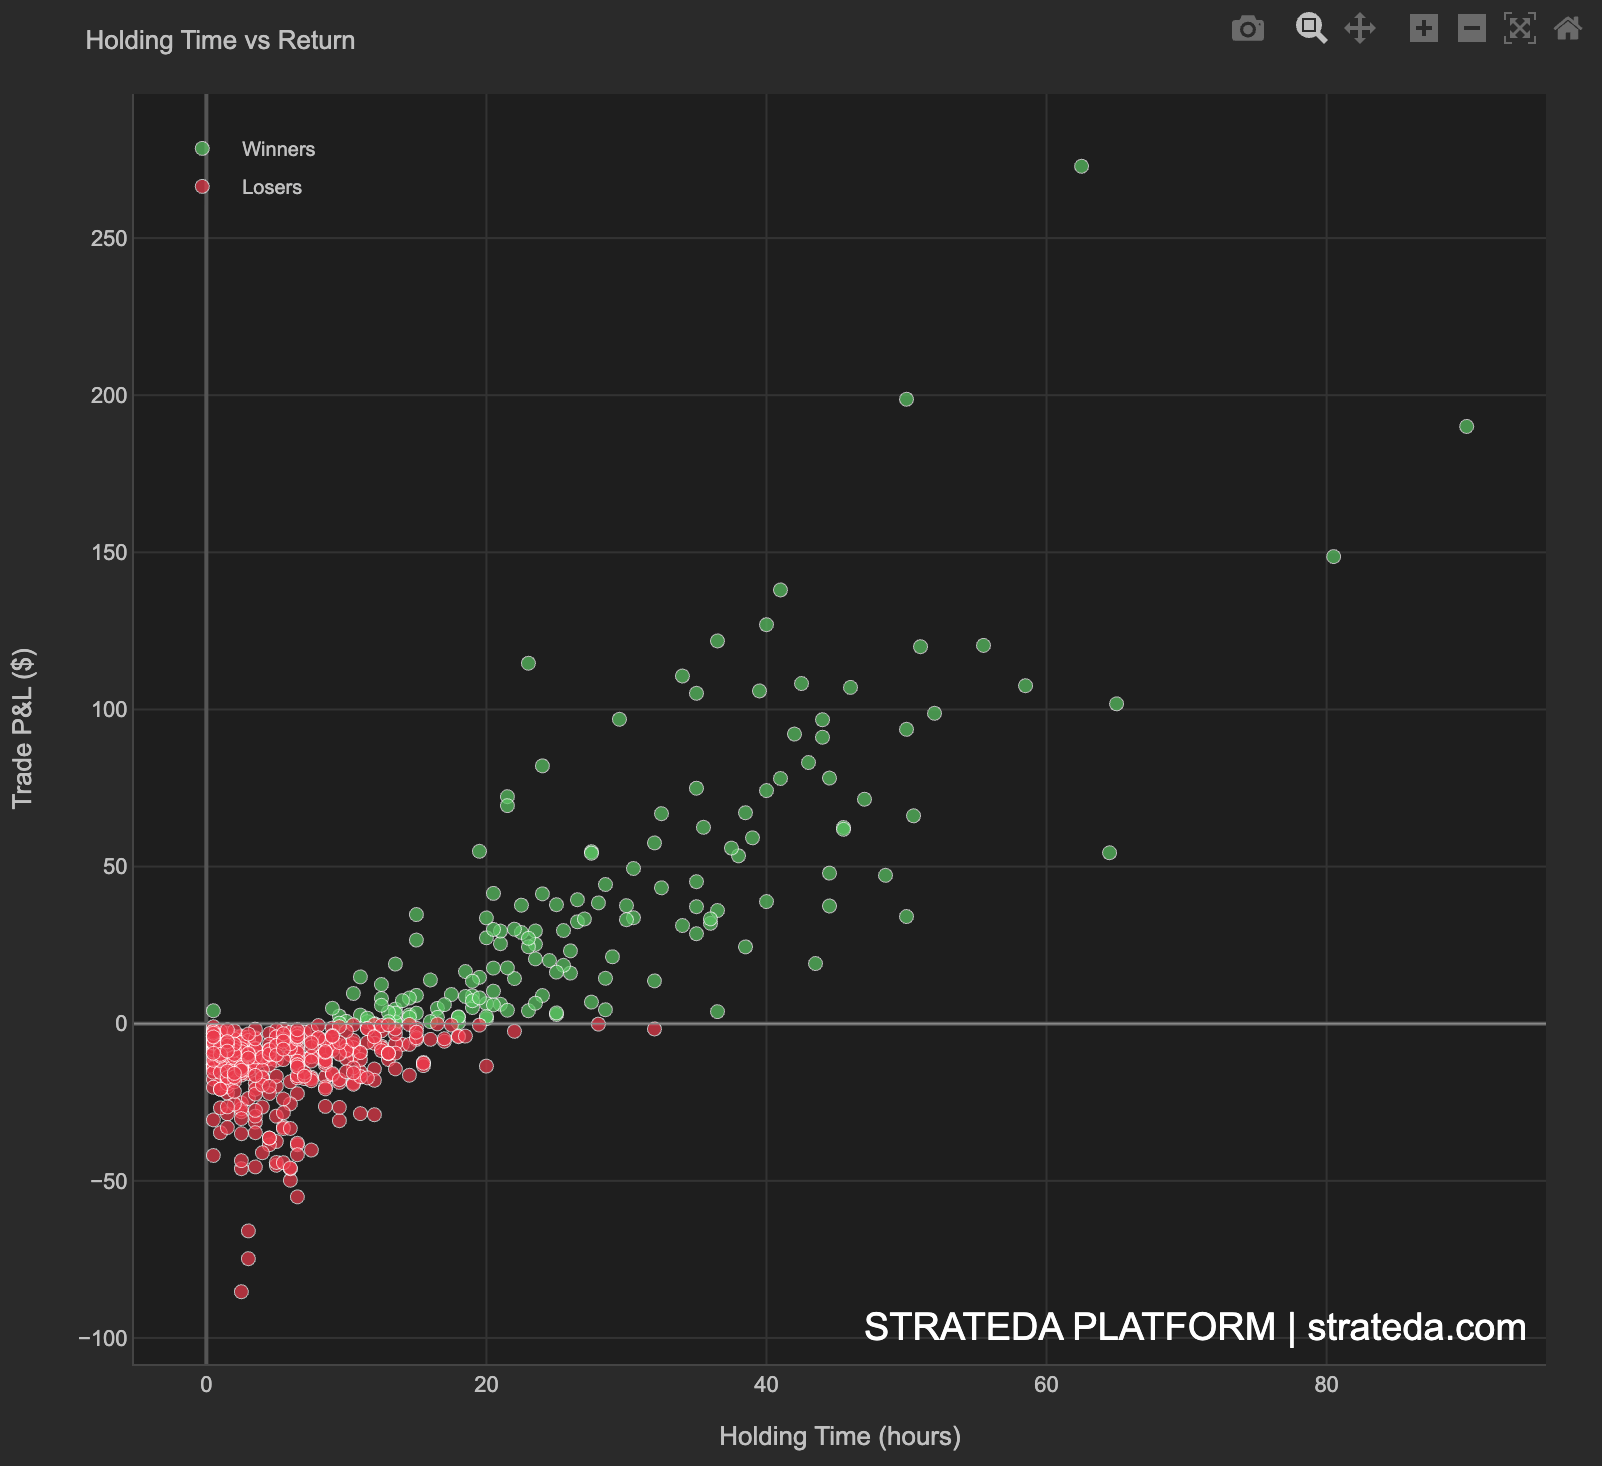
A scatter plot where each dot represents one trade:
- Green dots — Winning trades (closed with positive P&L).
- Red dots — Losing trades (closed with negative P&L).
- X-axis — Holding Time (hours).
- Y-axis — Trade P&L ($).
Losers tend to cluster at short holding times (0–5 hours), while winners are distributed across a wider range of holding durations. The spread of winning trades toward longer hold times indicates the strategy lets profitable trades run.
How to interpret it
Common patterns
Short holds = small P&L, long holds = large P&L (upward-tilting cluster): Profitable trades tend to be held longer. This is the classic trend-following signature — the strategy lets winners run. Losing trades are cut relatively quickly. This pattern indicates healthy trade management.
Short holds = positive P&L, long holds = negative P&L (downward-tilting cluster): The best trades are quick; extended trades tend to lose. This suggests the strategy's edge comes from short-term signals, and holding too long allows the edge to decay. Consider tightening exit conditions or adding a maximum hold time.
Horizontal cluster (no relationship): Hold time has no meaningful impact on return. Outcomes are driven by signal quality rather than duration. This is common for strategies with fixed take-profit and stop-loss exits.
Two distinct clusters: Winners and losers occupy different hold-time regions. For example, winners cluster at 4–8 hours while losers cluster at 12–24 hours. This gives you a concrete trade management insight: trades that haven't become profitable within a certain time window are more likely to lose.
Actionable insights
- If long holds are consistently unprofitable: Add a time-based exit rule (e.g., close after N bars if the trade hasn't reached its target). This cuts losses on stale trades.
- If short holds are consistently the best: Your exit signals may be too slow — the strategy captures the edge quickly but gives back profits by holding too long.
- If there's an optimal hold zone: A visible cluster of high-P&L trades at a specific hold duration suggests a natural cycle in the strategy's signal. Consider calibrating take-profit levels to match this duration.
Example
Hold Time vs Return for 200 trades on a DEMA/EMA crossover on EURCHF M30:
- Main cluster: Hold times of 2–12 hours (4–24 bars), P&L ranging from −25. Dense and slightly upward-tilting.
- Winning trades: Average hold time 8.5 hours. Winners that are held 10+ hours tend to capture larger gains.
- Losing trades: Average hold time 5.2 hours. Losses are typically cut faster than winners — the crossover exit fires sooner on adverse moves.
- Outlier trades: A few trades held 24–48 hours with large positive returns. These correspond to strong weekend or overnight momentum moves that the crossover didn't reverse.
Interpretation: The strategy naturally lets winners run and cuts losers shorter — a healthy profile for a momentum-based crossover. The shorter average hold time for losers confirms the exit signal (opposite crossover) fires quickly when momentum reverses. No time-based exit modification is needed; the crossover mechanism handles trade management effectively.