Monte Carlo Max Drawdown Distribution
What it is
The Monte Carlo Max Drawdown Distribution shows how the maximum drawdown varies across 1000 randomly reshuffled sequences of your actual trades. While your backtest produced one specific drawdown number, this chart shows the full distribution of drawdowns that your trade set could have produced under different orderings — revealing your realistic drawdown range, not just the single historical outcome.
Your backtest drawdown is one data point. This distribution gives you 1000. The difference between the two determines how much you should trust your backtest drawdown as a planning number.
How to access it
Navigate to the MC Drawdown tab in the Strategy Analytics popup. Available on Plus and above.
The Strategy Analytics popup is accessed via the table icon in the View Panel after your backtest completes. See The Strategy Panel & View System for full details.
What you see
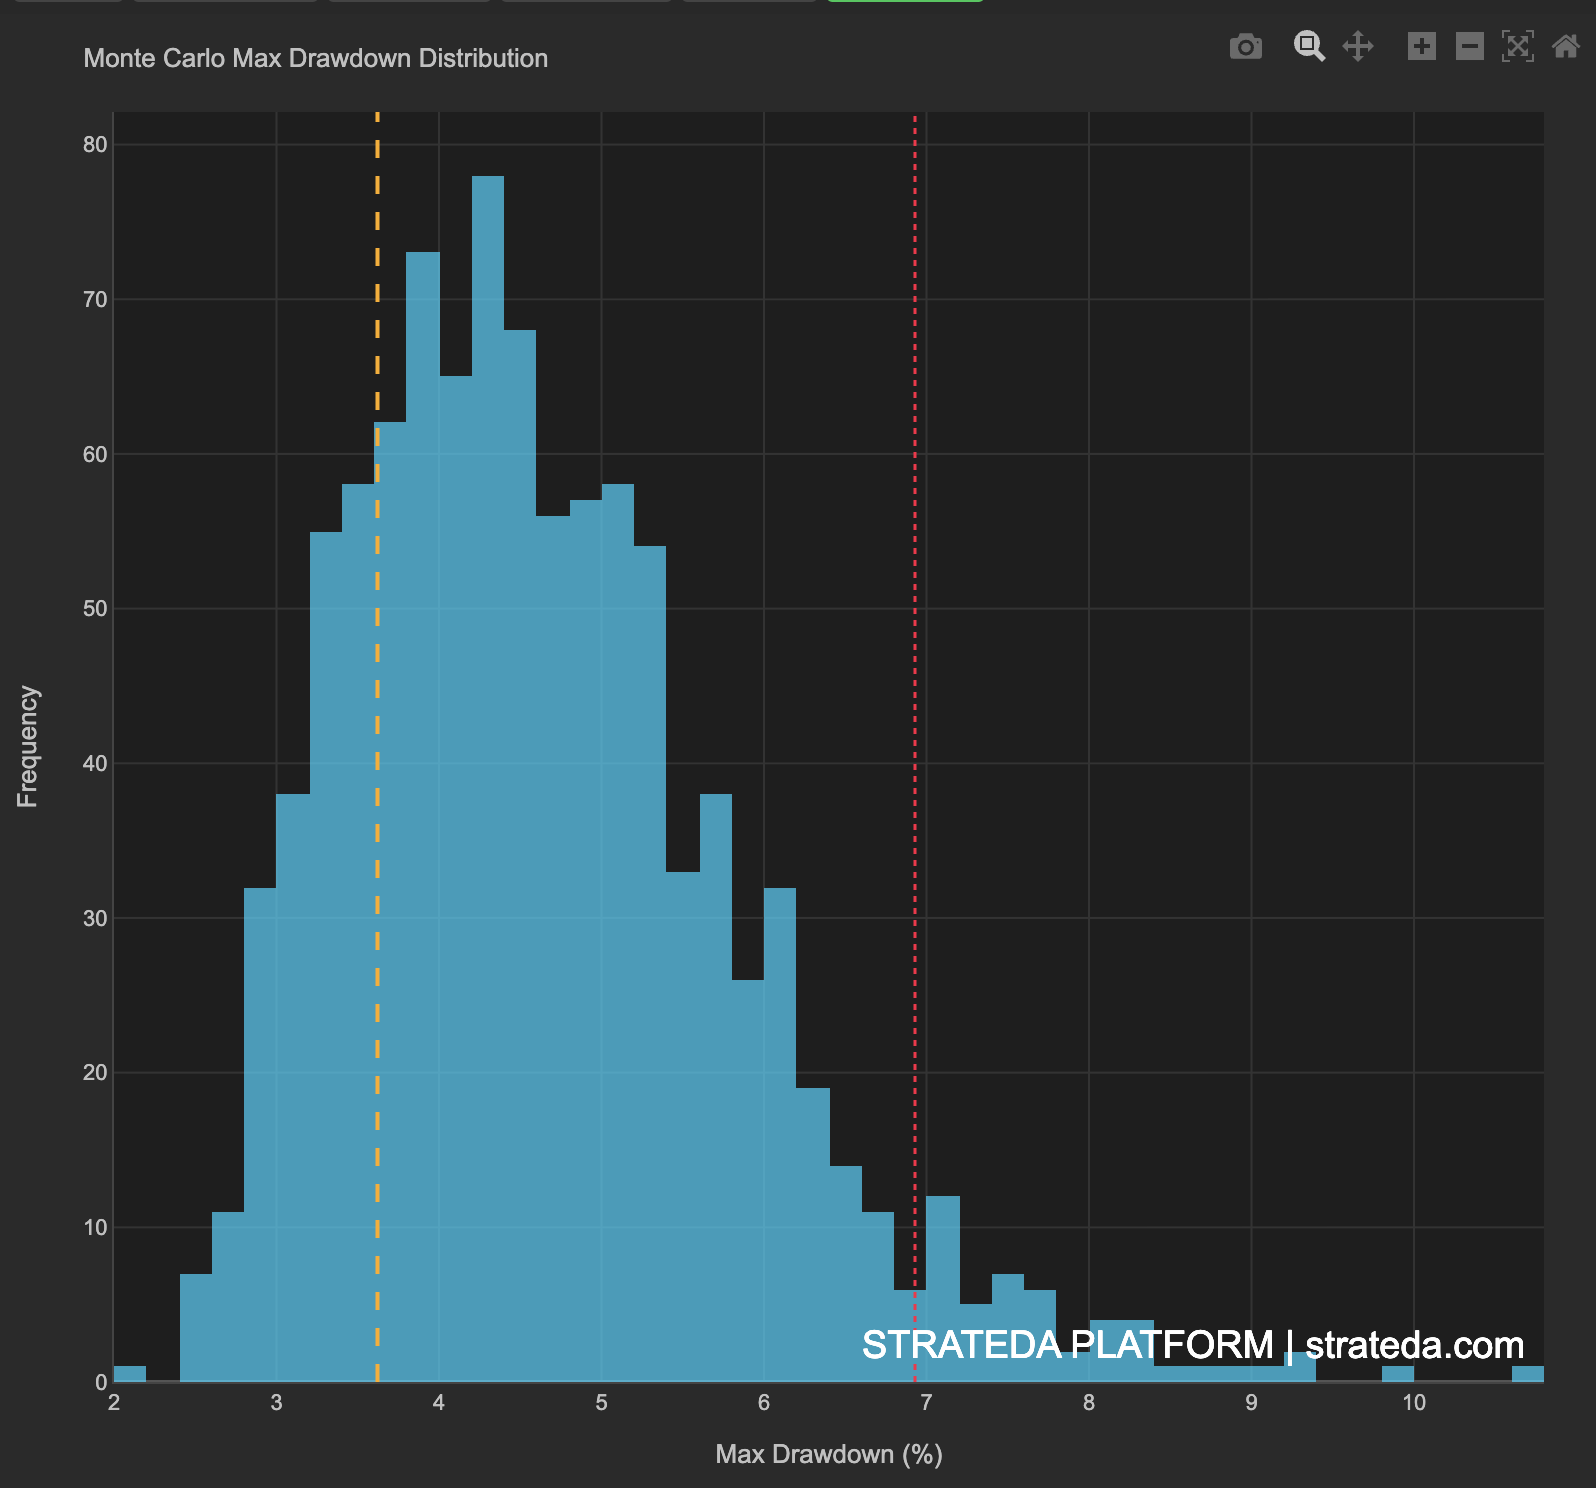
- Blue histogram — Distribution of max drawdown values across all 1000 simulations. Each bar represents a range of drawdown percentages and how many of the 1000 simulations produced a max drawdown in that range.
- Orange dashed line — Your actual backtest max drawdown. This marks where your historical result falls within the simulated distribution — showing whether your observed drawdown is typical or an outlier relative to what random reorderings of your trades would produce.
- Red dashed line — 95th percentile max drawdown — the worst 5% of simulated sequences. This is your realistic worst-case planning number.
- X-axis — Max Drawdown (%).
- Y-axis — Frequency (number of simulations producing that drawdown level).
How to interpret it
Plan for the 95th percentile, not the median
The red dashed line is your risk planning number. Under unlucky but plausible trade ordering, your strategy could draw down to this level. Size positions so that the 95th percentile drawdown does not exceed your risk tolerance or trigger a margin call.
Capital planning formula: If the 95th percentile max drawdown is −12%, ensure your account can absorb a 12% decline without forced liquidation or emotional decision-making. If you cannot tolerate that drawdown, reduce position size until the 95th percentile falls within your acceptable range.
Distribution width
Narrow distribution: Drawdown is relatively predictable regardless of trade sequence. Most simulations produce similar max drawdowns. Your risk is well-defined and the historical drawdown is a reliable planning number.
Wide distribution: A few large losing trades dominate the drawdown profile. The order they occur in dramatically affects the outcome. This strategy carries sequencing risk — consecutive large losses produce much worse drawdowns than the same losses spread across the sequence. Consider whether your position sizing accounts for this variability.
Your actual drawdown vs the distribution
Locate where your historical backtest drawdown falls within the histogram:
- Left edge (unusually low) — Your backtest experienced an atypically mild drawdown. Your live experience is more likely to resemble the median or worse. Do not use this favorable drawdown as your planning baseline — use the 95th percentile instead.
- Center of the distribution — Your backtest drawdown is representative of what you should expect. It is a reasonable planning number, though the 95th percentile remains the conservative choice.
- Right edge (unusually high) — Your backtest happened to sequence losing trades in a particularly unfavorable order. The median drawdown is a more representative planning number — your live experience is likely to be better than your backtest suggested.
Example
Monte Carlo Max Drawdown Distribution for 200 trades on a DEMA/EMA crossover on EURCHF M30:
- Histogram shape: Right-skewed, concentrated between −2.5% and −6%, with a tail extending to −9%.
- Actual backtest max drawdown (orange): −3.8%.
- 95th percentile max drawdown (red): −7.2%.
- Actual backtest max drawdown: −4.2% — sits just to the right of the median, well within the main body of the distribution.
Interpretation: The actual backtest drawdown of −4.2% is representative — it falls near the median of the Monte Carlo distribution. The 95th percentile of −7.2% is the number to use for capital planning. On a 720 drawdown under adverse trade ordering. The relatively narrow distribution (−2.5% to −7.2% covers 90% of outcomes) confirms that drawdown is predictable for this strategy — it does not depend heavily on a few large losing trades clustering together.
The trader uses the 95th percentile (−7.2%) for position sizing: with a maximum tolerable drawdown of 10%, the current position sizing leaves adequate buffer. If scaling up, the 95th percentile drawdown scales proportionally — doubling position size would produce a 95th percentile drawdown of approximately −14.4%.