Trade P&L Distribution
What it is
The Trade P&L Distribution shows a histogram of every individual trade's P&L outcome. Each bar represents a range of P&L values and how many trades fell in that range. This gives you an immediate picture of the shape of your trade outcomes — where most trades cluster, how wide the distribution is, and whether there are fat tails of large wins or losses.
This is the raw distribution view — no Gaussian overlay. For comparison against a normal distribution, see P&L vs Gaussian. Use this tab to read the exact distribution shape and the summary statistics displayed directly on the chart.
How to access it
Navigate to the P&L Dist tab in the Strategy Analytics popup. Available on Plus and above.
The Strategy Analytics popup is accessed via the table icon in the View Panel after your backtest completes. See The Strategy Panel & View System for full details.
What you see
- X-axis — Profit / Loss ($) per trade.
- Y-axis — Frequency (number of trades in each P&L bin).
- Green histogram bars — Count of trades in each P&L range.
- Orange dotted vertical line — Mean P&L across all trades, labeled with its value (e.g., "Mean: 1.68").
- Gray dashed vertical line — Zero P&L reference line.
- Skew and Kurt — Skewness and kurtosis values displayed in the top-right corner of the chart.
How to interpret it
Mean line position
The orange dotted mean line tells you the average trade outcome:
- Mean to the right of zero — The average trade is profitable. The further right, the higher your per-trade expectancy.
- Mean near zero — Average trade is breakeven. P&L depends heavily on a few outlier trades.
- Mean to the left of zero — The average trade loses. Even if overall P&L is positive (due to rare large wins), the typical experience is a loss.
Distribution shape
Tall, narrow peak near zero: Most trades produce small P&L in both directions. The strategy trades frequently with modest per-trade outcomes. Check the mean line position to determine if the typical trade is slightly profitable or slightly losing.
Wide, flat distribution: P&L is spread across a wide range. Individual trade outcomes vary greatly. High variance strategies require larger capital buffers to survive adverse sequences.
Right skew (long tail to the right): Occasional large winning trades. Most trades are small, but the right tail pulls the mean above the median. Typical of trend-following strategies. A positive skew value (shown in the Skew stat) confirms this.
Left skew (long tail to the left): Occasional large losing trades. Most trades win, but the left tail creates blow-up risk. A negative skew value confirms this — common in mean-reversion and premium-selling strategies.
Skew and Kurt statistics
The chart displays these directly:
- Skew — Positive = right-tailed (occasional large wins). Negative = left-tailed (occasional large losses). Values beyond ±1 indicate meaningful asymmetry.
- Kurt — Values above 3 indicate fat tails — extreme outcomes occur more often than a normal distribution predicts. The higher the kurtosis, the more important it is to size positions conservatively.
Relationship to P&L vs Gaussian
The P&L Dist and P&L vs Gaussian tabs show related but distinct views of the same data:
- P&L Dist — Raw histogram with mean line and summary stats. Best for reading the exact shape, frequency counts, and the Skew/Kurt values directly.
- P&L vs Gaussian — Overlays a fitted normal distribution for comparison. Best for understanding how much your returns deviate from normality and what that means for risk modeling.
Use both tabs together for a complete picture of your return distribution.
Example
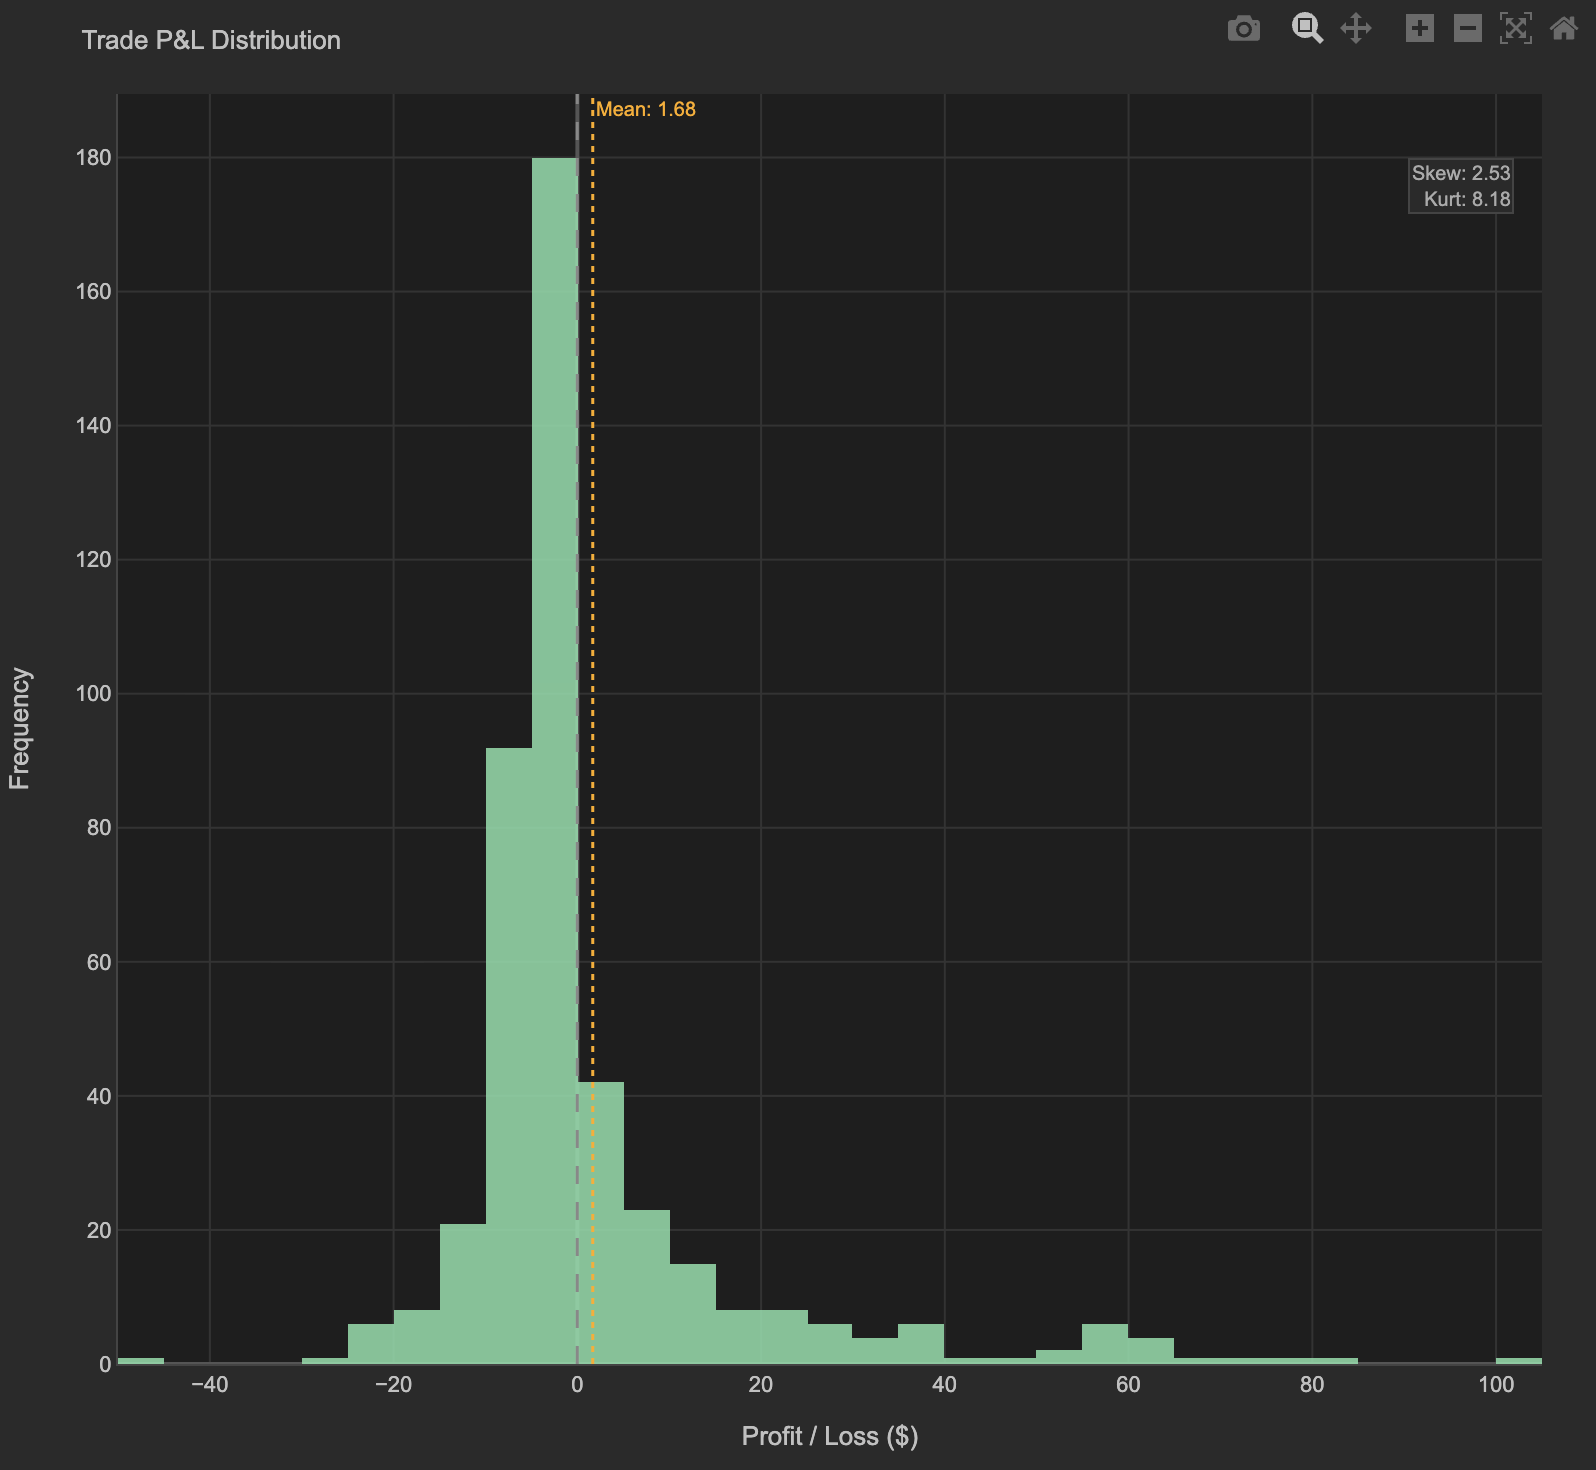
Trade P&L Distribution for 200 trades on a DEMA/EMA crossover on EURCHF M30:
- Histogram shape: Tall peak slightly right of zero, with a longer right tail than left tail.
- Mean line (orange): +$1.68 — positioned to the right of the zero line, confirming a positive per-trade expectancy.
- Skew: +1.24 — meaningful positive skew, consistent with a momentum crossover that captures occasional large trends.
- Kurt: 4.8 — above 3, indicating fat tails. Extreme outcomes (both positive and negative) occur more often than a normal distribution would predict.
Interpretation: The distribution confirms the strategy's edge comes from positive skew — most trades are small (clustered near zero) but the right tail contains occasional large wins that pull the mean positive. The kurtosis of 4.8 means standard deviation understates the true range of outcomes — position sizing should account for more extreme moves than a Gaussian model predicts. Cross-reference with P&L vs Gaussian to see exactly where the distribution exceeds the normal curve.