Setting Up Optimization Ranges
What it is
Parameter optimization lets you systematically test multiple values for each parameter in your strategy — instead of manually testing individual values, you define a range and let the platform test every combination. Strateda runs a full grid search across all specified ranges, backtesting each combination independently and ranking the results by the performance metric you choose.
This is the foundation of the entire optimization workflow. Every analytics view in this section — heatmaps, surface plots, robustness analysis, overfitting detection — depends on the parameter ranges you configure here.
Plan requirement: Plus and above.
How to access it
In the Strategy Builder, every numeric parameter field (indicator periods, thresholds, take-profit levels, stop-loss levels) has a gear icon next to it. Clicking the gear icon opens the optimization configuration popup for that parameter.
See No-Code Strategy Design for the full strategy builder interface — the gear icons appear next to every numeric parameter field in the Open Signal and Close Signal condition rows.
What you see
Configuring a parameter range
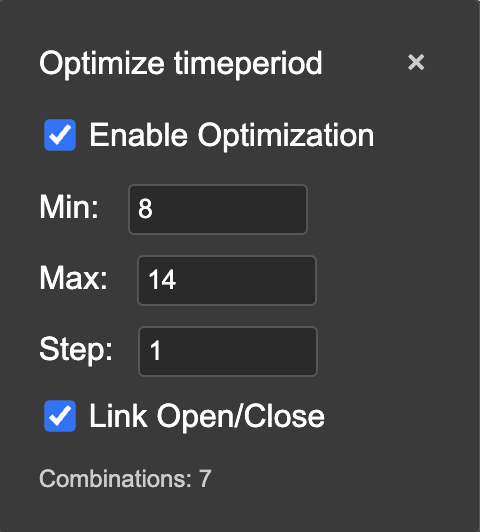
Clicking the gear icon next to any numeric parameter opens the optimization popup:
| Field | Description |
|---|---|
| Enable Optimization | Checkbox to activate optimization for this parameter. When unchecked, the parameter uses its fixed value and is not part of the grid search. |
| Min | Minimum value to test |
| Max | Maximum value to test |
| Step | Increment between values. Min 8, Max 14, Step 1 produces 7 values: 8, 9, 10, 11, 12, 13, 14 |
| Link Open/Close | When checked, this parameter is linked to the equivalent parameter in the close signal condition. Both are varied together as a single parameter rather than independently. See Linked Parameters below. |
| Combinations | Live preview of how many values this parameter contributes to the total grid |
Optimization settings panel
Below the strategy conditions, the optimization settings panel contains:
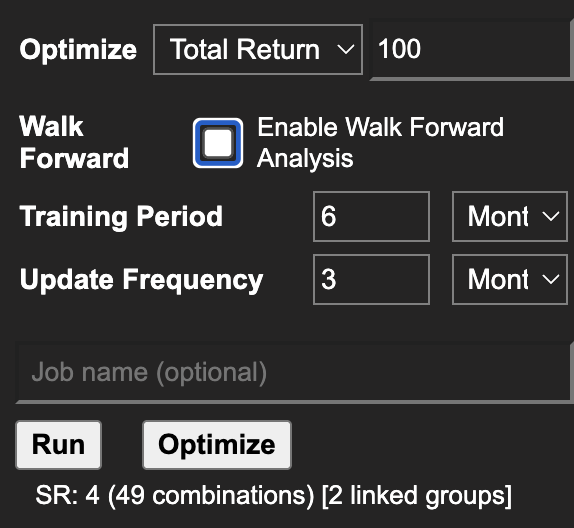
Optimize dropdown — Select the metric used to rank all parameter combinations. Available options:
- Total Return
- Profit Factor
- Sharpe Ratio
- Calmar Ratio
- Max Drawdown
- Win Rate
- Average Win/Loss
- Volatility
- Number of Trades
Min trades filter — A number field next to the metric dropdown. Combinations with fewer trades than this threshold are excluded from ranking. Use this to filter out combinations that produce too few trades to be statistically meaningful.
Walk Forward checkbox — Enables Walk-Forward Optimization mode. When checked, additional fields appear for Training Period and Update Frequency. Leave unchecked to run standard parameter optimization. See Walk-Forward Optimization for full details.
Combinations counter — Displayed below the Optimize button as: SR: X (Y combinations) [Z linked groups]
- SR — Number of strategy runs this job will consume from your hourly quota
- combinations — Total number of parameter combinations in the grid
- linked groups — Number of parameter pairs linked across open and close conditions
Running the optimization
Two buttons are available at the bottom of the strategy panel:
- Run — Executes a single backtest with the current fixed parameter values. Does not trigger optimization.
- Optimize — Executes the full grid search across all configured ranges. This is the button to click for optimization.
When you click Optimize, the platform submits the job to the cloud engine. The job appears in the job table with a progress indicator. When complete, a popup offers to load results immediately. Optimization results are stored for 7 days. See Job System for details on job tracking and result retention.
Linked parameters
When the Link Open/Close checkbox is enabled for a parameter, that parameter is synchronized across the open and close signal conditions. Both conditions vary together as one parameter in the grid — if the EMA period in the open condition is set to 20, the EMA period in the close condition is also set to 20 for that combination.
Without linking, the open and close parameters vary independently, producing a larger grid. With linking, they move together, reducing the grid size and ensuring the strategy uses consistent indicator settings for both entry and exit.
For linking to work, both the open and close condition parameters must have optimization enabled and the Link Open/Close checkbox checked.
The combinations counter shows linked groups in brackets — [2 linked groups] means two parameter pairs are synchronized across open and close conditions.
How to interpret it
Choosing ranges:
- Start with larger step sizes to identify promising regions, then narrow down with smaller steps in a follow-up run
- For indicator periods, a range of 5–65 in steps of 5 covers most practical values with a manageable combination count
- Watch the combinations counter — more combinations means longer run times and more strategy runs consumed from your quota
Quota consumption for optimization jobs:
Optimization jobs consume quota at a reduced rate compared to individual backtests — effective SR consumption is combinations × 0.1. A 400-combination grid search on Premium (90 SR/hour) consumes 40 SR, completing within a single hour. A 900-combination grid consumes 90 SR — exactly at the Premium limit. Plan your grid size accordingly: combinations × 0.1 must not exceed your plan's SR/hour quota.
Choosing the ranking metric:
- Sharpe Ratio — Best general-purpose choice. Balances return against volatility.
- Profit Factor — Prioritises consistency of wins over losses.
- Total Return — Simple but can favour high-risk combinations. Use alongside Sharpe.
- Calmar Ratio — Penalises deep drawdowns. Good for drawdown-sensitive strategies.
Min trades filter: Set this to at least 20–30 to exclude combinations that produced too few trades for meaningful metrics. A combination with 5 trades and a Sharpe of 3.0 is not comparable to one with 100 trades and a Sharpe of 1.5.
Example
A trader optimizes a dual EMA crossover on EURUSD M15:
- Clicks the gear icon next to the fast EMA timeperiod — sets Min: 5, Max: 30, Step: 5 (6 values). Checks Link Open/Close.
- Clicks the gear icon next to the slow EMA timeperiod — sets Min: 20, Max: 80, Step: 5 (13 values). Checks Link Open/Close.
- Sets ranking metric to Sharpe Ratio, min trades to 30.
- Combinations counter shows:
SR: 4 (78 combinations) [2 linked groups] - Clicks Optimize.
The job runs 78 combinations. When complete, the best combination by Sharpe ratio loads automatically in the View Panel. The trader clicks the global table icon to open the full optimization analytics — heatmaps, 3D surface, and robustness analysis.