Backtesting
What it is
A backtest simulates your strategy against historical market data to estimate how it would have performed. Strateda runs backtests in the cloud and produces a complete set of performance metrics, an equity curve, and a detailed trade log. Together, these outputs tell you whether your strategy has a quantifiable edge, how much risk it takes to capture that edge, and where individual trades occurred in the price history.
There are two backtesting modes, each using a different data source and cost model:
-
Non-MT5 mode — Uses simplified formulas for position sizing and cost modeling. Works with either Databento data (professional-grade 1-minute OHLC and BBO data from 2018, covering 120 US equities and 11 CME futures contracts) or MT5 broker data — selectable via the data source dropdown. When using MT5 data in Non-MT5 mode, no spread is assumed and simplified cost formulas apply. Results are directionally useful for signal discovery and rapid iteration but not production-accurate. Available on all plans.
-
MT5 mode — Uses your broker's MetaTrader 5 terminal for profit, margin, and spread calculations. When MT5 mode is enabled, backtests use your broker's real spreads, commissions, swap rates, and margin requirements via MT5's built-in calculation functions. Note: MT5-sourced data can also be used without MT5 mode — in that case no spread is assumed and simplified cost formulas apply. MT5 mode is the combination of MT5 data AND broker-accurate cost calculations. Requires Plus plan or higher and an active MT5 broker connection.
The data source difference matters: Non-MT5 mode gives you access to curated, high-quality Databento data with consistent BBO spreads across all instruments. MT5 mode gives you access to your broker's full instrument universe — forex, indices, commodities, and any other instruments your broker provides — with broker-specific pricing and execution characteristics. Many traders use both: Non-MT5 for broad signal research, MT5 for production validation.
How to access it
- Open the Strategy Builder panel and configure your strategy — select an instrument, set a candle interval, add indicators, define open/close conditions, and set position parameters.
- Click the Run button to submit the backtest.
The backtest runs in Non-MT5 mode by default. If you have an MT5 connection configured, you can switch to MT5 mode before running.
Job states
When you click Run, the platform submits your strategy configuration as a job to the cloud backtesting engine:
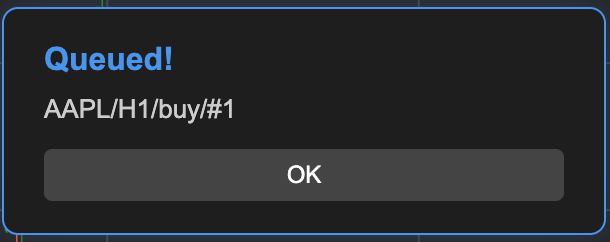
- Queued — The job enters the queue and waits for available capacity. If your hourly strategy run quota is exhausted, the job is automatically rescheduled to the next hour.
- Running — The simulation is executing on cloud infrastructure.
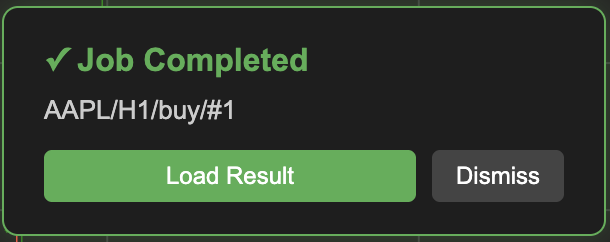
- Completed — A popup appears offering to load results immediately. Click Load results to display them, or dismiss and reload later from the job table.
- Failed — The job encountered an error. Check the job table for details.
Completed backtest results are stored for 7 days and can be reloaded from the job table at any time without re-running the computation. See Job System for full details on job tracking, queuing, and result retention.
The amount of historical data available to your backtest depends on your plan:
| Plan | Bar Limit | Approximate Coverage (H1 bars) |
|---|---|---|
| Free | 1,000 bars | ~6 months |
| Plus | 4,500 bars | ~2.2 years |
| Pro | 15,000 bars | ~7.4 years |
| Premium | 37,500 bars | full history (from 2018) |
Note: assumes ~390 H1 bars per trading month for stocks. CME Futures with extended hours generate more bars per calendar month.
Each plan also limits how many strategy runs you can execute per hour:
| Plan | Strategy Runs per Hour |
|---|---|
| Free | 4 |
| Plus | 20 |
| Pro | 45 |
| Premium | 90 |
What you see when results load
When a backtest completes and you load results, the workspace updates with three visible layers:
Equity curve in the View Panel The loaded strategy appears as an equity curve entry in the View Panel on the right side. The curve shows cumulative P&L across all trades. See The Strategy Panel & View System for full details on how to navigate, compare, and manage loaded results.
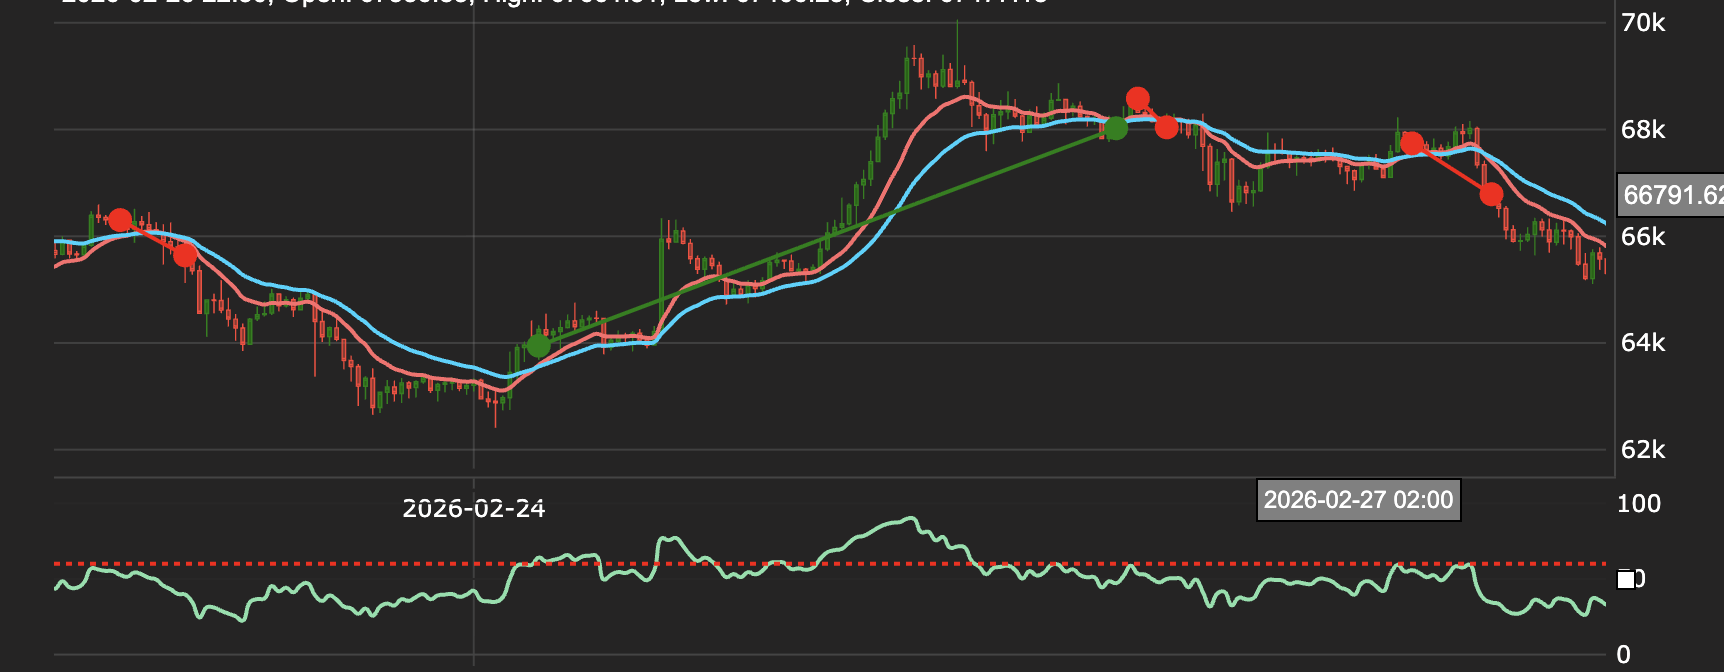
Trade markers on the price chart Entry and exit points appear as circular markers directly on the candle chart. Green markers indicate entry points, red markers indicate exit points. Zoom into any section of the chart to inspect individual trade signals in detail — each marker shows exactly where the strategy acted relative to price action and the configured indicators.
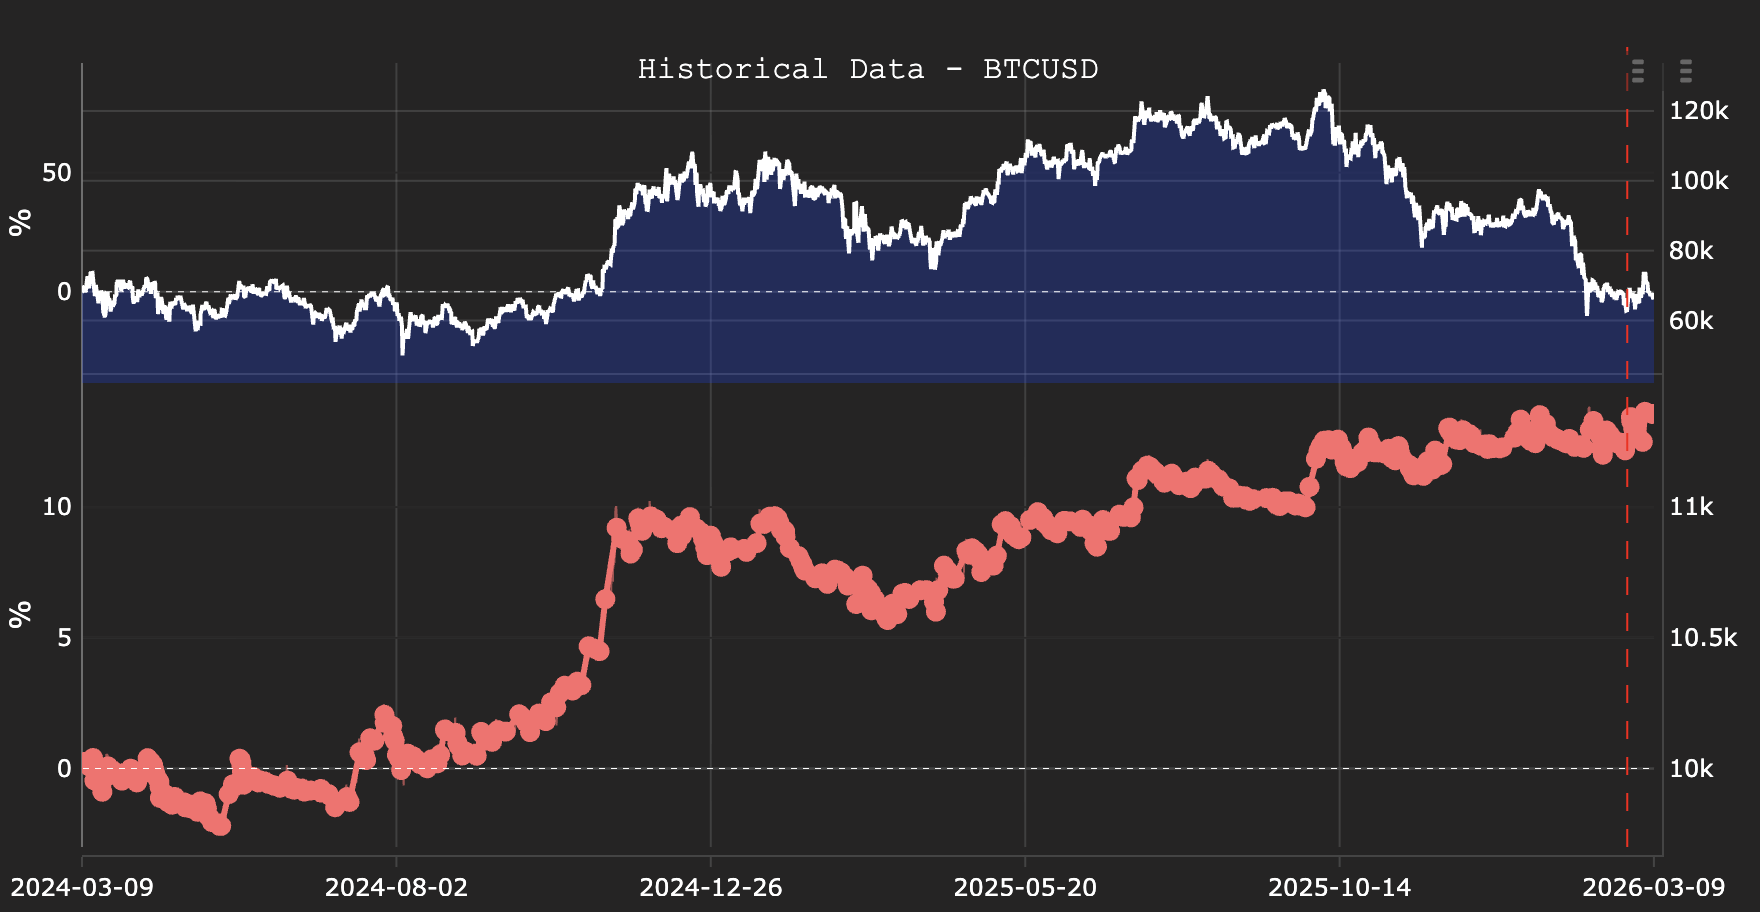
Historical data comparison Click the right panel button on the equity curve entry to open the historical data view — a split display showing the strategy's cumulative equity curve alongside the underlying instrument's price history over the same period. This comparison reveals how the strategy's performance relates to the instrument's price movement — whether it captured trending moves, avoided drawdown periods, or underperformed during specific market regimes.
To open the full analytics suite — 20+ charts covering P&L distribution, rolling Sharpe, Monte Carlo simulation, drawdown analysis and more — click the table icon on the equity curve entry. See Backtest Analytics.
How to interpret results
Reading the equity curve
The shape of the equity curve reveals characteristics that metrics alone cannot capture:
- Steady upward slope — Consistent performance across the backtest period.
- Flat periods followed by spikes — Returns concentrated in specific periods rather than distributed evenly.
- Single large jump — Most of the return comes from one trade.
- Steep drawdown followed by recovery — A significant decline before the curve resumes its trajectory.
- Downward slope at the end — Performance deteriorating in the most recent data.
Reading trade markers
Zoom into specific sections of the price chart to inspect trade markers:
- Are entries occurring at logical points relative to the indicators you configured?
- Are exits happening too early (leaving profit on the table) or too late (giving back gains)?
- Do multiple consecutive losing trades cluster in a specific market regime (e.g., choppy sideways action)?
This visual inspection is an essential complement to the quantitative metrics.
Non-MT5 vs MT5 comparison
Non-MT5 and MT5 mode results will differ for the same strategy because of how costs are calculated. A common workflow is:
- Use Non-MT5 mode to rapidly iterate and find promising signals.
- Switch to MT5 mode to validate the top candidates with production-accurate cost modeling.
- Only deploy strategies that pass both stages.
Example
A trader wants to test a DEMA/EMA crossover strategy on EURUSD using M30 candles:
- In the Strategy Builder, select EURUSD as the instrument and M30 as the interval.
- Set the open condition: DEMA(14) crosses above EMA(21) (Crossover type, Buy direction).
- Set the close condition: DEMA(14) crosses below EMA(21) (Crossover type).
- Set position parameters: Balance 10,000, PosSize/Margin 0.2, Hours 08:00–20:00.
- Click Run.
The backtest executes in Non-MT5 mode. Results load after a few seconds:
| Metric | Value |
|---|---|
| Return % | 14.3% |
| Sharpe Ratio | 1.35 |
| Profit Factor | 1.72 |
| Max Drawdown | 9.1% |
| Win Rate | 47% |
| W/L Ratio | 2.1 |
| Trade Count | 42 |
The Sharpe of 1.35 with 42 trades is encouraging — the sample is large enough to be directionally meaningful. The win rate of 47% is below 50%, but the W/L ratio of 2.1 means winners are more than twice the size of losers. The equity curve shows a steady upward trend with two visible drawdown periods that both recovered.
The trader clicks the table icon on the equity curve to open the Backtest Analytics dashboard — reviewing the Rolling Sharpe for stability, the P&L Distribution for fat tails, and the Monte Carlo simulation for worst-case drawdown estimates. Satisfied that the signal quality is promising, the next step is to re-run in MT5 mode to validate with real broker costs, then proceed to Parameter Optimization.