P&L by Time (Hour × Day Heatmap)
What it is
The Hour × Day heatmap maps your strategy's profitability across the hour of the day (0–23 UTC) and day of the week (Monday–Friday). Each cell shows the average P&L for trades that occurred during that time slot. This reveals when your strategy performs best and worst — information that can directly improve net returns by informing scheduling decisions.
Different market hours have fundamentally different characteristics: liquidity, volatility, institutional participation, and spread behavior all follow daily and weekly cycles. Your strategy's performance inherits these patterns, and this heatmap makes them visible.
How to access it
Navigate to the Hour × Day tab in the performance dashboard. Available on Plus and above.
What you see
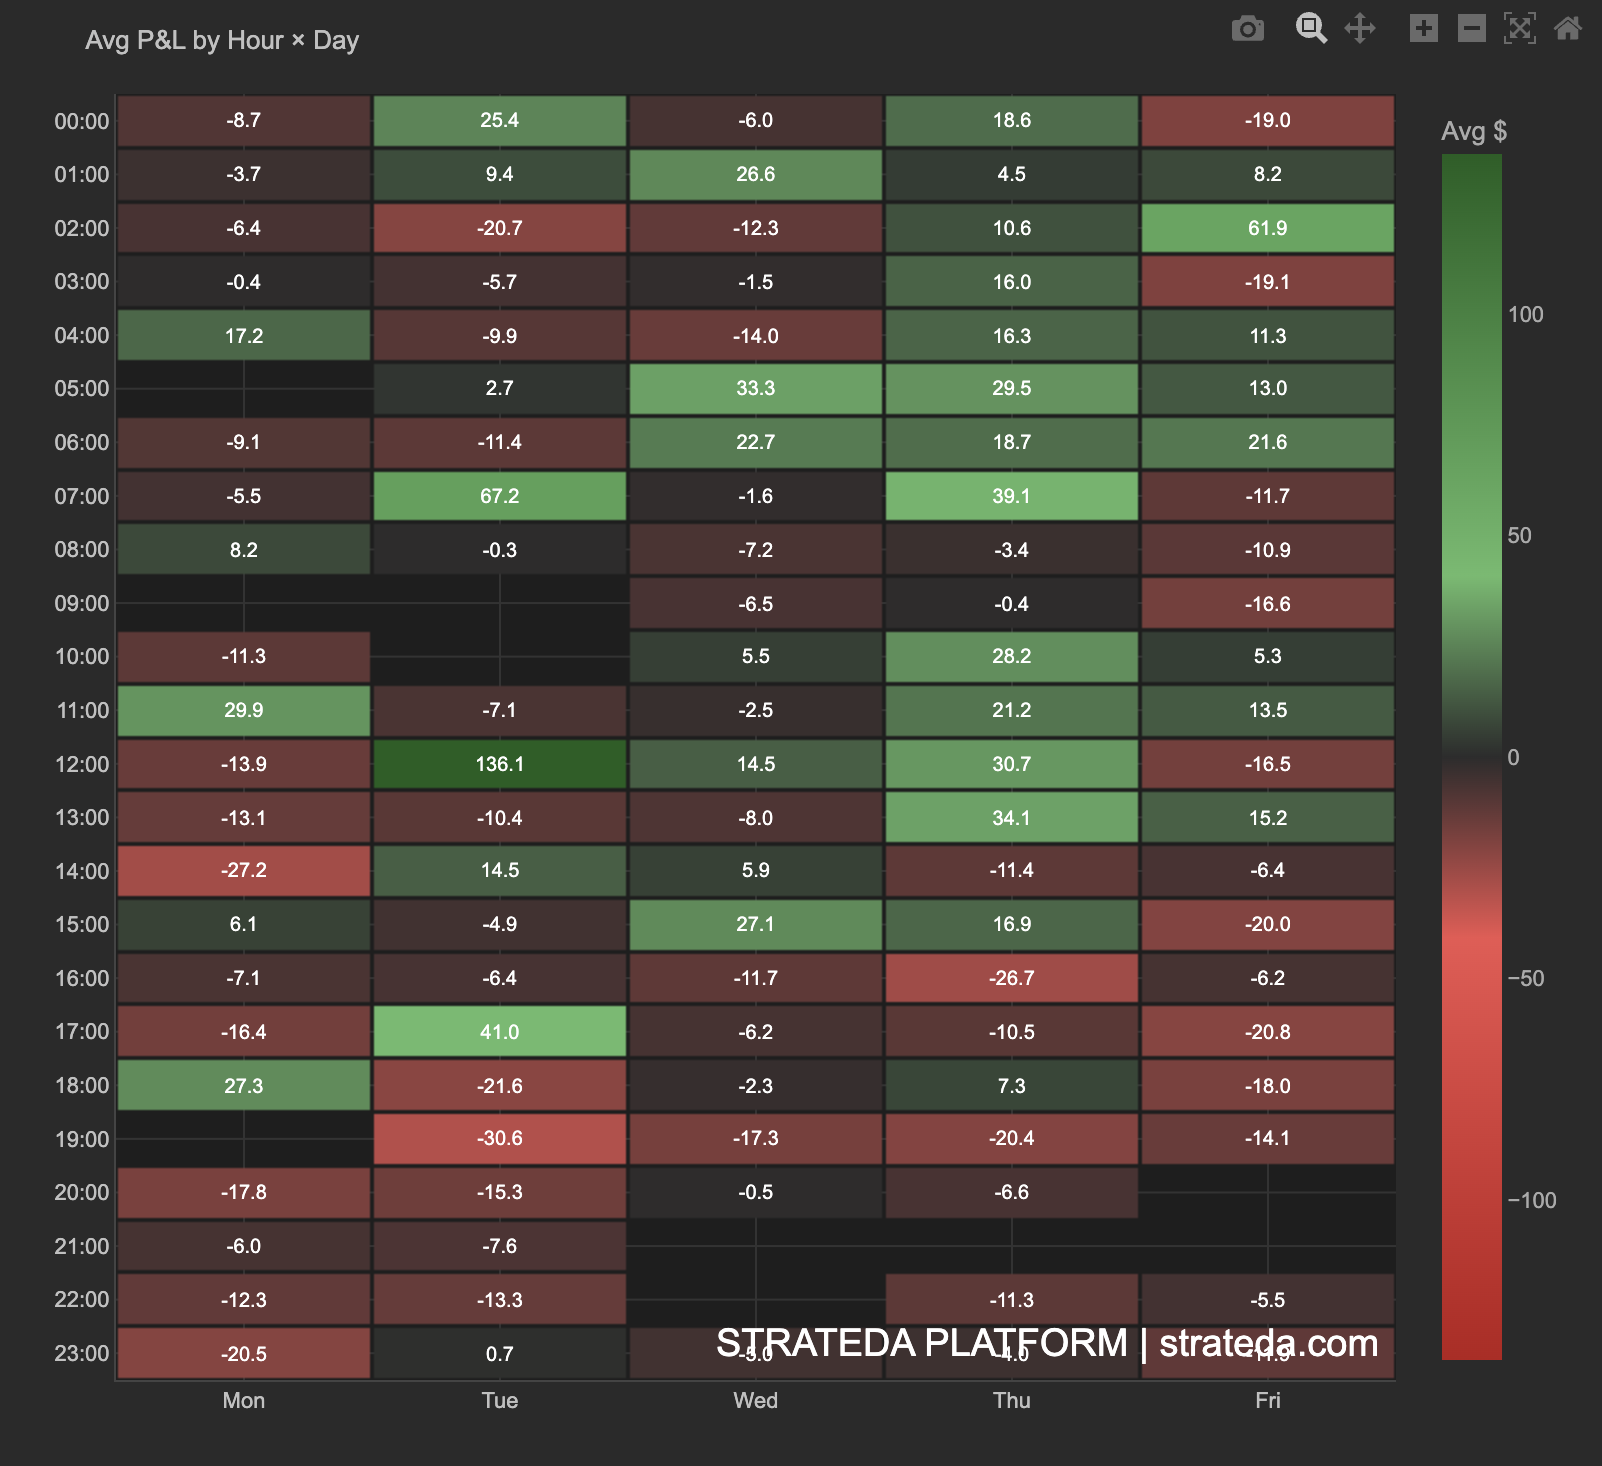
A heatmap where:
- X-axis — Day of the week (Monday through Friday).
- Y-axis — Hour of the day (0–23 UTC).
- Cell color — Average P&L for trades executed during that hour/day combination. Green indicates profitable average P&L; red indicates losing average P&L.
- Cell values — The exact average P&L or total P&L for each cell.
- Cell opacity or weight — May vary with trade count to indicate statistical reliability of each cell.
How to interpret it
Time-of-day patterns
Best performance during London/NY overlap (12:00–16:00 UTC): Common for strategies that benefit from high liquidity and strong directional moves. These are the most active market hours with the tightest spreads.
Best performance during Asian session (22:00–06:00 UTC): Characteristic of strategies that capture overnight drift or range-bound mean reversion. Some momentum strategies perform well during thin-liquidity hours where small orders can create directional moves. Performance varies significantly by hour and day with no universally dominant session — the pattern is strategy and instrument dependent.
Poor performance during session opens (08:00, 13:30 UTC): Session opens often have spike-and-reverse behavior that whipsaws crossover signals. If your strategy consistently loses during these hours, consider delaying signal processing by 15–30 minutes after opens.
Day-of-week patterns
Monday weakness: Monday mornings (especially early Asian hours) often have wider spreads and gap risk from weekend news. Strategies may underperform until liquidity normalizes.
Friday afternoon weakness: Position unwinding ahead of the weekend can create counter-trend moves. Trend-following strategies often lose during Friday afternoon reversals.
Mid-week strength: Tuesday through Thursday typically offer the most consistent conditions for most strategy types.
Actionable decisions
The heatmap directly informs strategy scheduling — but with an important caveat. Removing a losing time slot improves average P&L per trade, but also reduces total trade count. The net effect on total P&L depends on whether the improvement in per-trade quality outweighs the reduction in volume.
When to restrict trading hours:
- A time slot has consistently negative average P&L across 30+ trades — statistically reliable.
- Removing it doesn't eliminate more than 15–20% of total trades.
- The slot's loss is larger than its share of trades (e.g., 10% of trades but 25% of losses).
When not to restrict:
- A time slot has negative P&L from only 5–10 trades — not enough data to be sure.
- The slot generates your highest trade volume — removing it would dramatically reduce overall exposure.
- The Temporal Slippage Patterns show that slippage is the primary issue — fixing execution (e.g., server selection) may be better than avoiding the hours.
Example
P&L by time heatmap for 200 trades on a DEMA/EMA crossover on EURCHF:
| Time Block | Avg P&L | Trade Count | % of Total P&L |
|---|---|---|---|
| 22:00–06:00 (Asian) | +$6.80 | 68 | 45% |
| 06:00–08:00 (Pre-London) | +$3.20 | 24 | 8% |
| 08:00–12:00 (London AM) | +$2.10 | 42 | 9% |
| 12:00–16:00 (Overlap) | +$1.80 | 36 | 6% |
| 16:00–21:00 (NY PM) | +$4.50 | 18 | 8% |
| 21:00–22:00 (Transition) | −$2.40 | 12 | −3% |
Day-of-week pattern: Monday average P&L is +5.80 (strongest). Friday afternoon (after 16:00) shows −$1.20 average.
Interpretation: Performance varies significantly by hour and day with no universally dominant session — the pattern is strategy and instrument dependent. The 21:00–22:00 transition slot (NY close / Asian open) is the only consistently losing period, but with only 12 trades, the sample is small.
The trader confirms that 24-hour trading is optimal for this strategy — restricting to London/NY hours would eliminate the strongest performance window. The finding reinforces the Strategy Development Example insight that removing hour restrictions doubled performance for this strategy type.