Rolling Sharpe Ratio
What it is
The Rolling Sharpe Ratio calculates the Sharpe ratio over a sliding window of recent trades (typically the last 30 trades) and plots it as a time series. While the overall Sharpe is a single number summarizing your entire history, the rolling version reveals how performance evolves. A strategy with an overall Sharpe of 1.0 could have been consistently around 1.0 the entire time, or it could have been 2.0 for the first half and 0.0 for the second. The rolling view shows which.
This is one of the most important monitoring tools for live strategies. A declining rolling Sharpe is an early warning signal — potentially indicating a regime change, edge decay, or deteriorating execution quality — and gives you time to react before the damage shows up in the equity curve.
How to access it
Navigate to the Rolling Sharpe tab in the performance dashboard. Available on Plus and above.
What you see
-
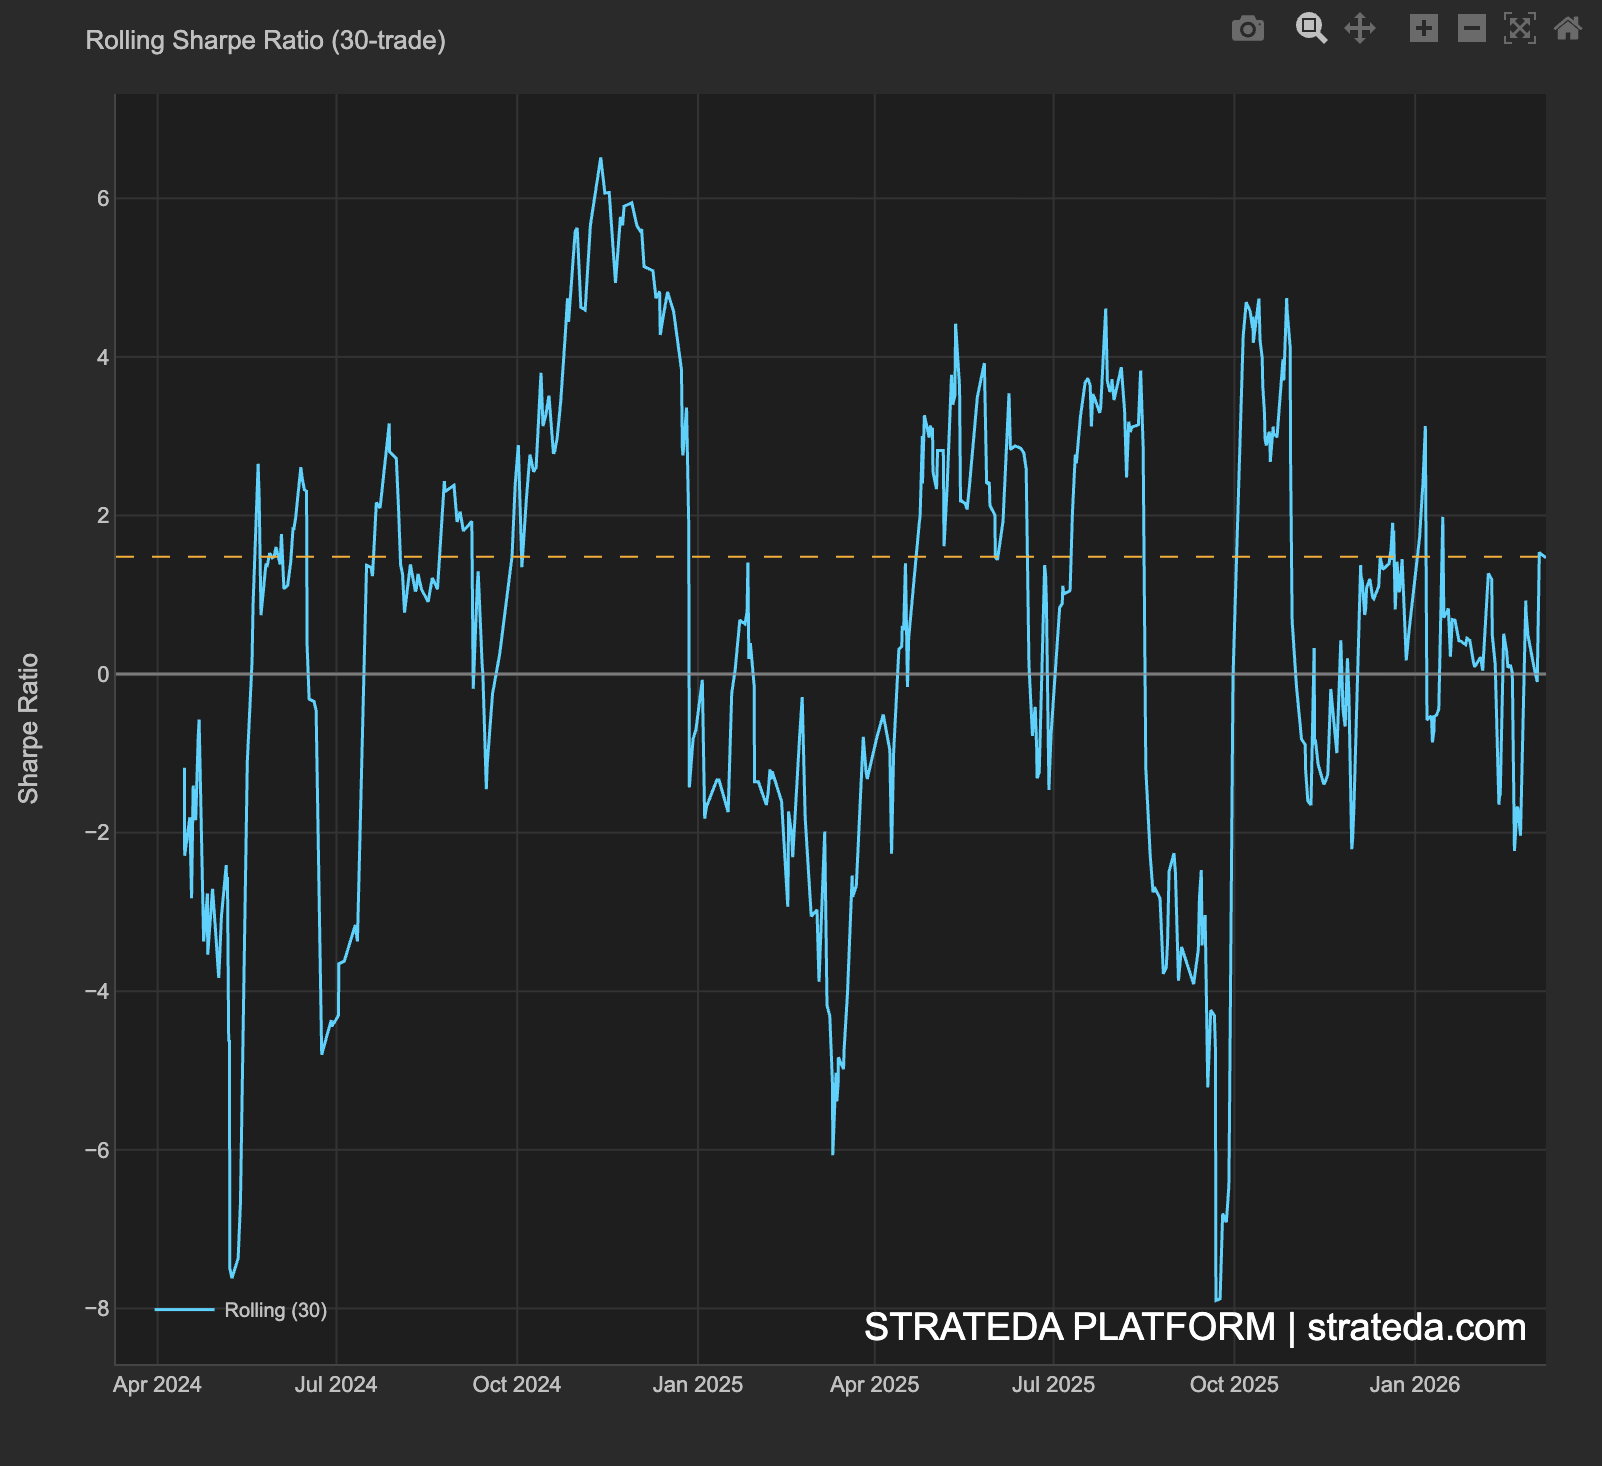
X-axis — Calendar date (the date of each trade in the backtest period).
-
Y-axis — Sharpe ratio calculated over the trailing window. Values shown are annualized — the raw rolling Sharpe for each window is multiplied by √(estimated trades per year) based on the full backtest period. This means the scale reflects annualized risk-adjusted return, not the raw per-window ratio.
-
Rolling line — The Sharpe ratio at each point, computed from the preceding N trades (default window: 30 trades).
-
Reference lines — A solid horizontal line at Sharpe = 0 (breakeven) and a dashed orange line showing the overall Sharpe ratio for the full backtest period.
-
The chart title confirms the rolling window size used (e.g., 'Rolling Sharpe Ratio (30-trade)'). The legend shows 'Rolling (30)'.
The line starts at trade N (once enough trades exist to fill the window) and updates with each subsequent trade.
How to interpret it
Stability patterns
Flat, above 1.0: The strategy performs consistently well. Risk-adjusted returns are stable and strong. This is the ideal profile for live deployment — predictable, reliable performance.
Fluctuating around a positive mean: Normal variability. The Sharpe oscillates above and below its average but stays mostly positive. Check whether the dips correspond to identifiable market conditions. If they do, the strategy has regime dependency but a genuine edge.
Trending downward: Performance is deteriorating over time. Possible causes:
- Market regime has changed (e.g., from ranging to trending, or vice versa).
- Edge decay — the strategy's signal has become less effective.
- Execution quality has worsened (check TCA).
- Overfitting — the parameters were fitted to a past regime that no longer exists.
Sharp drop followed by recovery: A temporary drawdown period, potentially caused by a specific market event or regime. If recovery is complete, the strategy is resilient. Monitor whether subsequent drops are getting deeper or more frequent.
Consistently near zero or negative: The strategy has no meaningful edge. If this persists across 50+ trades, consider pausing the strategy and re-evaluating.
Using the rolling Sharpe for decisions
These thresholds apply to the annualized values shown in this chart.
| Rolling Sharpe behavior | Action |
|---|---|
| Stable above 0.8 for 50+ trades | Continue at current size; consider increasing |
| Dipped below 0 but recovering | Monitor closely; don't change size during recovery |
| Below 0 for 30+ consecutive trades | Pause strategy; investigate cause |
| Trending downward for 3+ months | Re-optimize parameters on recent data |
Example
Rolling 30-trade Sharpe for a DEMA/EMA crossover on EURCHF across 200 trades:
- Trades 30–80: Rolling Sharpe ranges from 0.9 to 1.5. Strong, consistent performance.
- Trades 80–110: Rolling Sharpe dips to 0.2. Corresponds to a low-volatility EURCHF period where crossover signals generated many small losses.
- Trades 110–200: Rolling Sharpe recovers to 0.8–1.2. The strategy resumes normal performance as volatility returns.
Interpretation: The dip at trades 80–110 is regime-dependent, not edge decay. The recovery to prior levels confirms the strategy's edge is intact. The trader notes the vulnerability to low-volatility periods and may consider adding a volatility filter for future versions, but doesn't need to pause the current deployment.