Platform UI
What it is
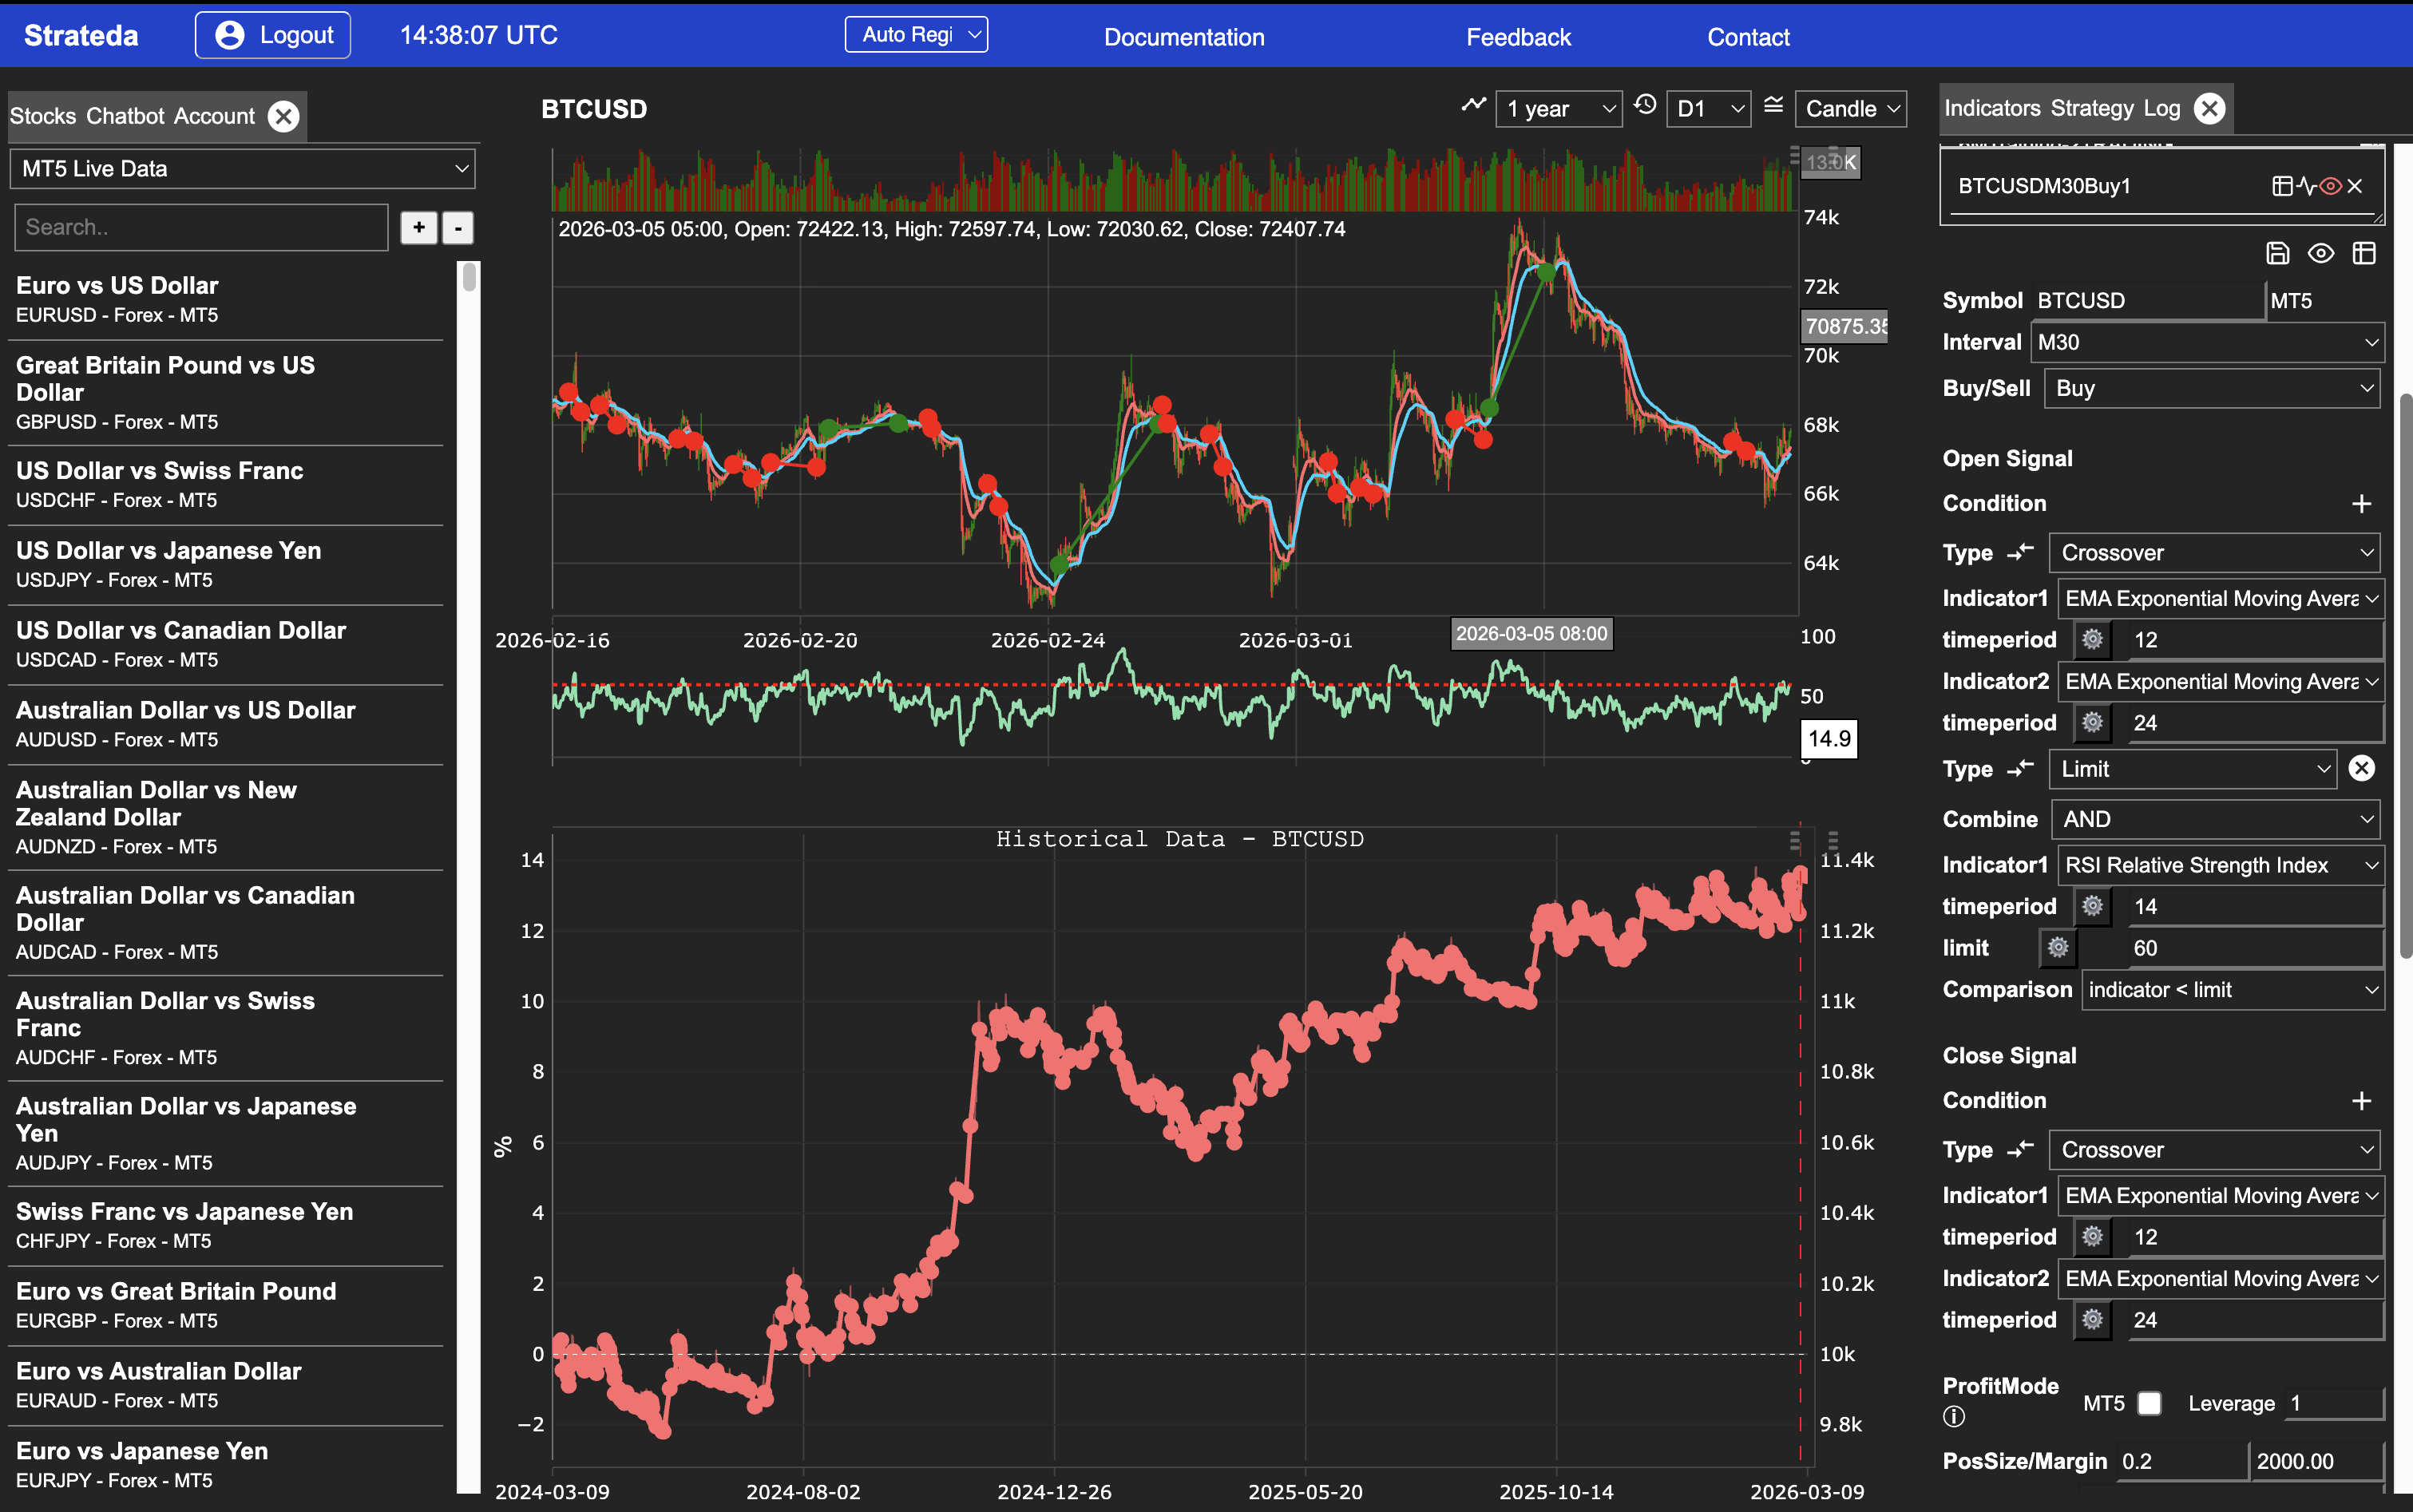
The Strateda user interface is a single-page workspace where you build, test, and analyze trading strategies without switching between separate tools or screens. The layout is designed around a three-panel structure so that instrument selection, charting, and strategy configuration are all visible simultaneously.
How to access it
Log in at app.strateda.com. The workspace loads immediately after authentication. All plans — including Free — have access to the full UI layout.
What you see
The workspace is organized into three major sections:
Left Panel — Instruments, AI & Account
This panel handles instrument selection and platform utilities:
- Instrument search — Find stocks and futures by symbol or name.
- Watchlist — Save frequently used instruments for one-click switching. Your watchlist persists across sessions and carries your current strategy configuration when switching instruments.
- AI Chatbot — Ask questions about your strategies or the platform, or use Strategy Mode to generate strategies from natural language descriptions. Available on Plus plans and above.
- Account information — View your current plan, usage, and settings.
Navigate between these functions by clicking the tab names at the top of the panel.
Middle Panel — Charts
The central area displays interactive price charts for your selected instrument:
- Candle charts — The platform displays the last year of daily candle data by default. You can switch between multiple candle intervals (1-minute through daily).
- Indicator overlays — Any technical indicators you add to your strategy appear directly on the chart or in sub-panels below it.
- Trade markers — After running a backtest, entry and exit points are plotted on the chart so you can visually inspect each trade.
- Drag-and-drop — Strateda supports drag-and-drop interaction within the chart area for repositioning and navigation.
Right Panel — Strategy & Results
This panel is where you build strategies and review results:
- Indicator tab — Browse and apply indicators from the library of 75 TA-Lib indicators (SMA, EMA, RSI, MACD, BBANDS, and many more). Indicators draw on the chart when you click Apply.
- Strategy tab — Build strategy conditions by selecting indicators, parameters, and open/exit rules. Click Run to create a strategy job.
- Open signal conditions — Define entry rules using crossover, limit, or other condition types.
- Close signal conditions — Set exit rules including take-profit, stop-loss, crossover, and limit-based exits.
- Position settings — Configure position size, leverage, and account balance.
The lower portion of this panel is the Strategy Panel & View System — used for loading, comparing and analysing results across backtests, optimization runs, WFO jobs and live strategies. See The Strategy Panel & View System for full documentation.
Navigate between strategy configuration and results by clicking the tab names at the top of this panel.
App Bar
The blue app bar at the top of the workspace contains: the Strateda logo, a Logout button, a UTC clock showing the current server time, a Server Region dropdown, and links to Documentation, Feedback, and Contact.
The Server Region dropdown (labelled Auto Region by default) selects which Strateda backend server serves the UI. Options are Auto Region, US Region, and EU Region. Auto Region automatically selects the lowest latency backend based on your location. This affects UI responsiveness only and is completely separate from the MT5 execution server region, which is configured in the EA Inputs within MetaTrader 5 and controls live trade signal delivery — see Server Selection.
How to interpret it
The three-panel layout follows a natural left-to-right workflow: select your instrument on the left, view the chart in the center, and configure or review your strategy on the right.
When you run an optimization or walk-forward analysis, the results area expands with additional tabs for heatmaps, 3D surface plots, equity curve fans, and other analytics views — all accessible without leaving the workspace.
Indicators update in real time on the chart as you modify parameters, so you can visually confirm your logic before running a full backtest.
Example
To run your first backtest from the workspace:
- Left panel — Search for an instrument (e.g., AAPL) and click to select it. The chart loads in the center.
- Right panel — Click the indicators tab and add an RSI with a 14-period setting.
- Right panel — Set an open condition (e.g., RSI crosses above 30) and a close condition (e.g., take-profit at 2%).
- Click Run Backtest.
- Right panel — Switch to the results tab to review the equity curve, performance metrics, and trade log. Entry and exit markers now appear on the chart in the middle panel.