Monthly Performance
What it is
The Monthly Performance chart displays your strategy's total P&L for each calendar month across all backtest years. Each cell shows the dollar return for that month, color-coded green for profitable months and red for losing months. This gives an immediate visual picture of seasonal patterns, consistency across years, and which months are reliably strong or weak.
This view answers questions that the equity curve and trade-level analytics cannot: "Does my strategy have a seasonal bias? Are there months I should avoid? Is performance consistent year over year, or is my edge decaying?"
How to access it
Navigate to the Monthly tab in the Strategy Analytics popup. Available on Plus and above.
The Strategy Analytics popup is accessed via the table icon in the View Panel after your backtest completes. See The Strategy Panel & View System for full details.
What you see
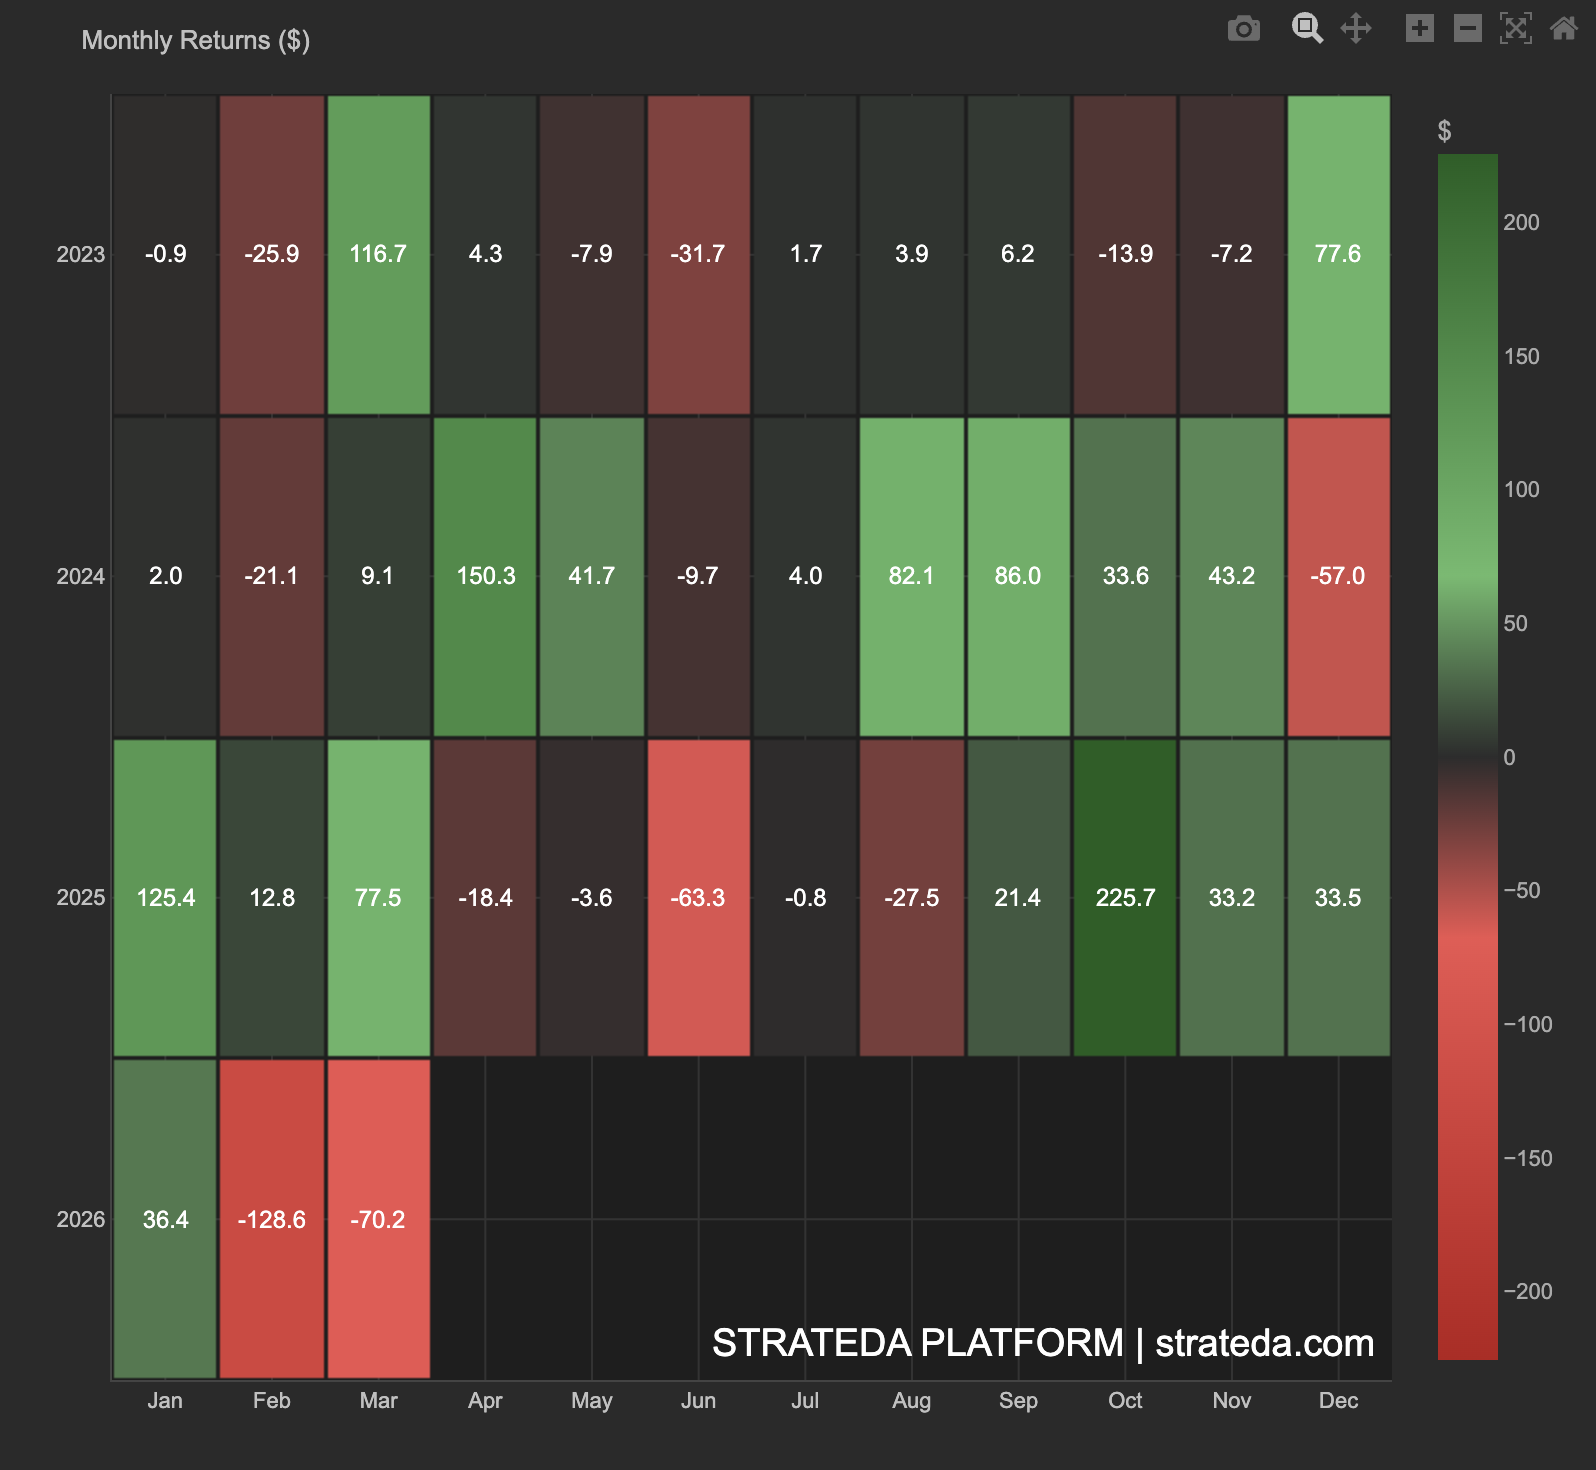
- Rows — Each year covered by the backtest (e.g., 2023, 2024, 2025, 2026).
- Columns — Calendar months (Jan through Dec).
- Cell value — Total P&L ($) for that month.
- Cell color — Green = profitable month; red = losing month. Color intensity scales with magnitude — bright green = large gain, bright red = large loss, dark = near zero.
- Color scale — Labeled "$" on the right, ranging from the largest loss (deep red) to the largest gain (deep green).
- Empty cells — Months outside the backtest date range appear black.
How to interpret it
Consistent green across a column (same month, multiple years)
This month is reliably profitable for your strategy across different years. This may reflect genuine seasonal patterns — for example, certain currency pairs or equities have historically strong months driven by institutional flows, earnings cycles, or macroeconomic releases.
Consistent red across a column
This month consistently loses. Consider whether restricting the strategy during this calendar month would improve overall P&L. Before acting on this, verify the pattern holds across at least 3 years — a single bad month in one year is not a pattern.
Mixed colors with no pattern
Monthly performance is random with respect to the calendar. This is normal for many strategies — no seasonal adjustment is needed or meaningful.
One extremely bright cell (large outlier)
A single month dominates the P&L. Check whether this is a legitimate trade outcome or an anomaly. If one month accounts for more than 30% of total backtest P&L, the strategy may be highly regime-dependent rather than consistently profitable.
Improving trend across rows (more green in recent years)
The strategy may be becoming better calibrated over time, or recent market conditions favour its logic. Cross-reference with the Rolling Sharpe to confirm.
Deteriorating trend across rows (more red in recent years)
Edge decay. The strategy was stronger in earlier years. Consider whether re-optimization on recent data would help, or whether the market has structurally changed.
Practical use
Monthly performance is most actionable when a clear seasonal pattern exists across multiple years. If a specific month is consistently negative with meaningful magnitude, adding a calendar filter (restricting trading during that month) can improve risk-adjusted returns without changing the core strategy logic.
Always verify patterns across at least 3 years before filtering. A two-year pattern may be coincidence; a three-year consistent pattern is more likely structural.
Example
Monthly Performance for a DEMA/EMA crossover on EURCHF M30 (backtest covering 2023–2026):
| Jan | Feb | Mar | Apr | May | Jun | Jul | Aug | Sep | Oct | Nov | Dec | |
|---|---|---|---|---|---|---|---|---|---|---|---|---|
| 2023 | +$82 | +$145 | −$38 | +$210 | +$95 | −$12 | +$160 | +$88 | −$45 | +$120 | ||
| 2024 | +$75 | +$130 | +$92 | +$180 | −$65 | +$155 | +$110 | +$25 | +$140 | −$30 | +$85 | +$95 |
| 2025 | +$105 | +$88 | +$150 | +$195 | −$42 | +$170 | +$125 | −$18 | +$115 | +$70 | +$60 | +$130 |
| 2026 | +$90 | +$115 | +$135 |
Interpretation: May is consistently red across all three complete years (−65, −145, +195). Most other months show mixed but generally positive results with no dominant pattern. The improving trend (more green, larger values) in 2025 vs 2023 suggests the strategy edge is strengthening or recent EURCHF conditions are favorable.
The trader investigates whether restricting trading during May would improve net results. Removing May's average loss of −$48/month and its 12 trades from the backtest would marginally improve Sharpe but reduce sample size. The decision depends on whether the May pattern persists — three years is the minimum for a seasonal signal to be credible.