Cost by Time (Cost × Hour Heatmap)
What it is
The Cost × Hour heatmap shows the average trading cost of a trade, grouped by the hour and weekday in which it was entered. The cost of each trade is everything the backtest charged it: spread, commission, swap and futures roll costs, added together.
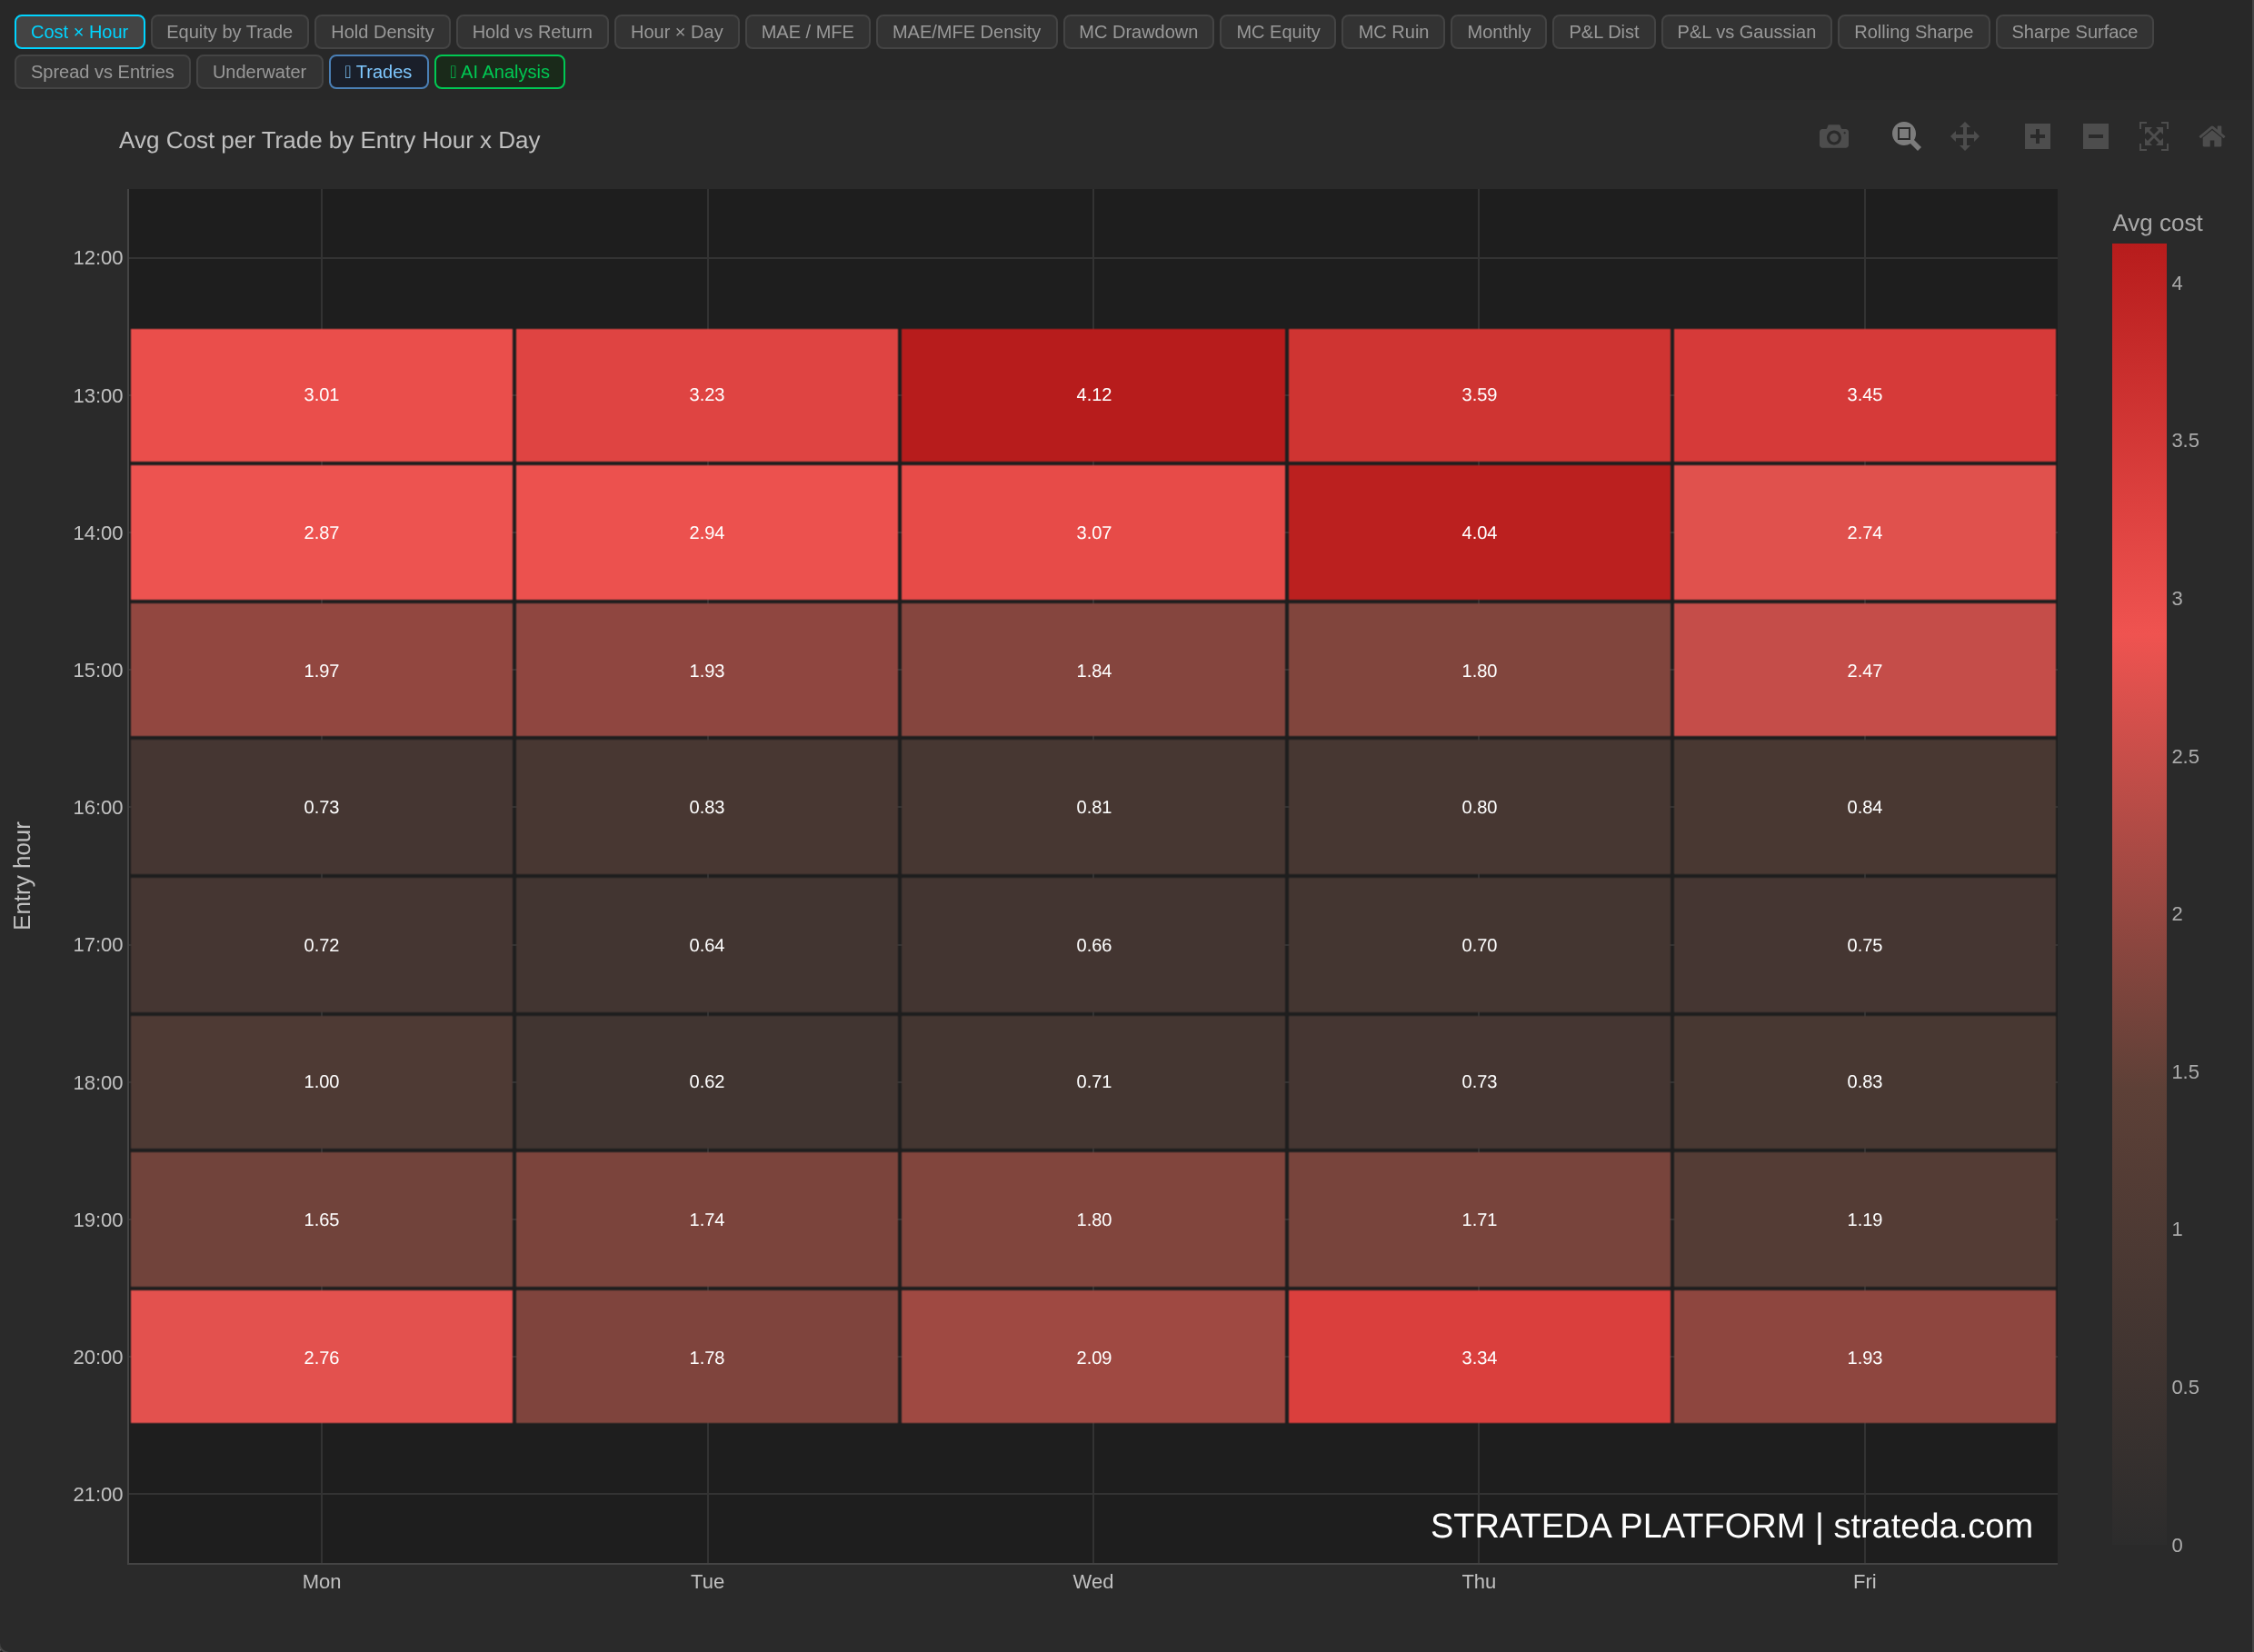
AAPL M1, 1,804 trades. Entries in the first hour of the US session (13:00 to 14:00 UTC) cost 3 to 4 per trade; from 16:00 to 18:00 they cost 0.6 to 1.0. Costs rise again into the close at 20:00.
It answers a question the P&L by Time heatmap cannot: when a time slot loses money, is that because the strategy's signals are poor there, or because trading there is expensive? A strategy that enters near the daily rollover, when spreads widen sharply, can look like a good idea before costs and a losing one after them.
How to access it
Open the Cost × Hour tab in the Strategy Analytics panel after a backtest. Available on Plus and above.
The tab appears only when the backtest recorded per-trade costs.
What you see
A heatmap where:
- X-axis: Day of the week (Monday through Friday).
- Y-axis: Entry hour, covering the hours the strategy traded plus one hour either side.
- Cell colour: Average cost per trade for trades entered in that hour and day. Dark cells are cheap, red cells are expensive. There is no green end: a cost is never a gain, so the scale runs one way.
- Cell values: The average cost per trade, to two decimals.
Costs are positive when paid. A swap credit, where the broker pays you to hold overnight, lowers a trade's cost and can make a cell's average smaller.
How to interpret it
Read it beside the P&L heatmap
The useful reading is a comparison: the hours that glow red here are often the hours where Hour × Day is weakest. The difference between the two is the cost. If a slot is profitable before costs and losing after them, the signals are fine and the timing is expensive.
The two heatmaps use different clocks
This chart groups trades by when they were entered. The Hour × Day heatmap groups them by when they were closed. With an average holding time near an hour, the two maps are typically one row apart, so do not read them cell by cell. Compare the pattern, not the exact row.
Grouping by entry also does not mean the cost was charged at entry. A cell reads "trades entered in this hour cost this much, round trip", including spread paid on exit and any swap charged overnight.
Typical patterns
One bright row around the daily rollover: spreads on many FX and CFD instruments widen sharply for a few minutes around the end of the trading day. A strategy whose signals cluster there pays for it on every trade.
A uniform map: costs do not depend on timing. Restricting trading hours will not reduce them; they come from the instrument, timeframe and cost settings, not from when the strategy trades.
Brighter cells late in the week: often swap. Positions opened on a Wednesday are commonly charged three days of swap at once.
Example
A EURCHF M5 strategy shows a positive average P&L in most hours, but its Cost × Hour map has one bright red row at 21:00. That row holds 52 of the strategy's 81 entries. Before costs the backtest made +669; after costs it lost 254.
The Spread vs Entries chart confirms the cause: the tallest cost bar and the tallest entry-count bar are the same hour. The strategy is not failing; it is entering at the most expensive moment of the day. The next experiment is to re-run it with trading hours that exclude the rollover and see whether the net result changes sign.