Rolling Sharpe Surface (Multi-Scale)
What it is
The Rolling Sharpe Surface extends the single-window rolling Sharpe into a 2D heatmap that computes the Sharpe ratio across multiple window sizes simultaneously. Instead of choosing one window (e.g., 30 trades), it calculates the Sharpe for every combination of trade number and window size, producing a surface that reveals performance patterns at different scales — from short-term (10-trade windows) to long-term (100+ trade windows).
This is one of the most analytically powerful views in the platform. It detects performance regimes that a single rolling window misses: a strategy might look fine on a 30-trade window while deteriorating on a 100-trade scale, or vice versa.
How to access it
Navigate to the Sharpe Surface tab in the performance dashboard. Available on Plus and above.
What you see
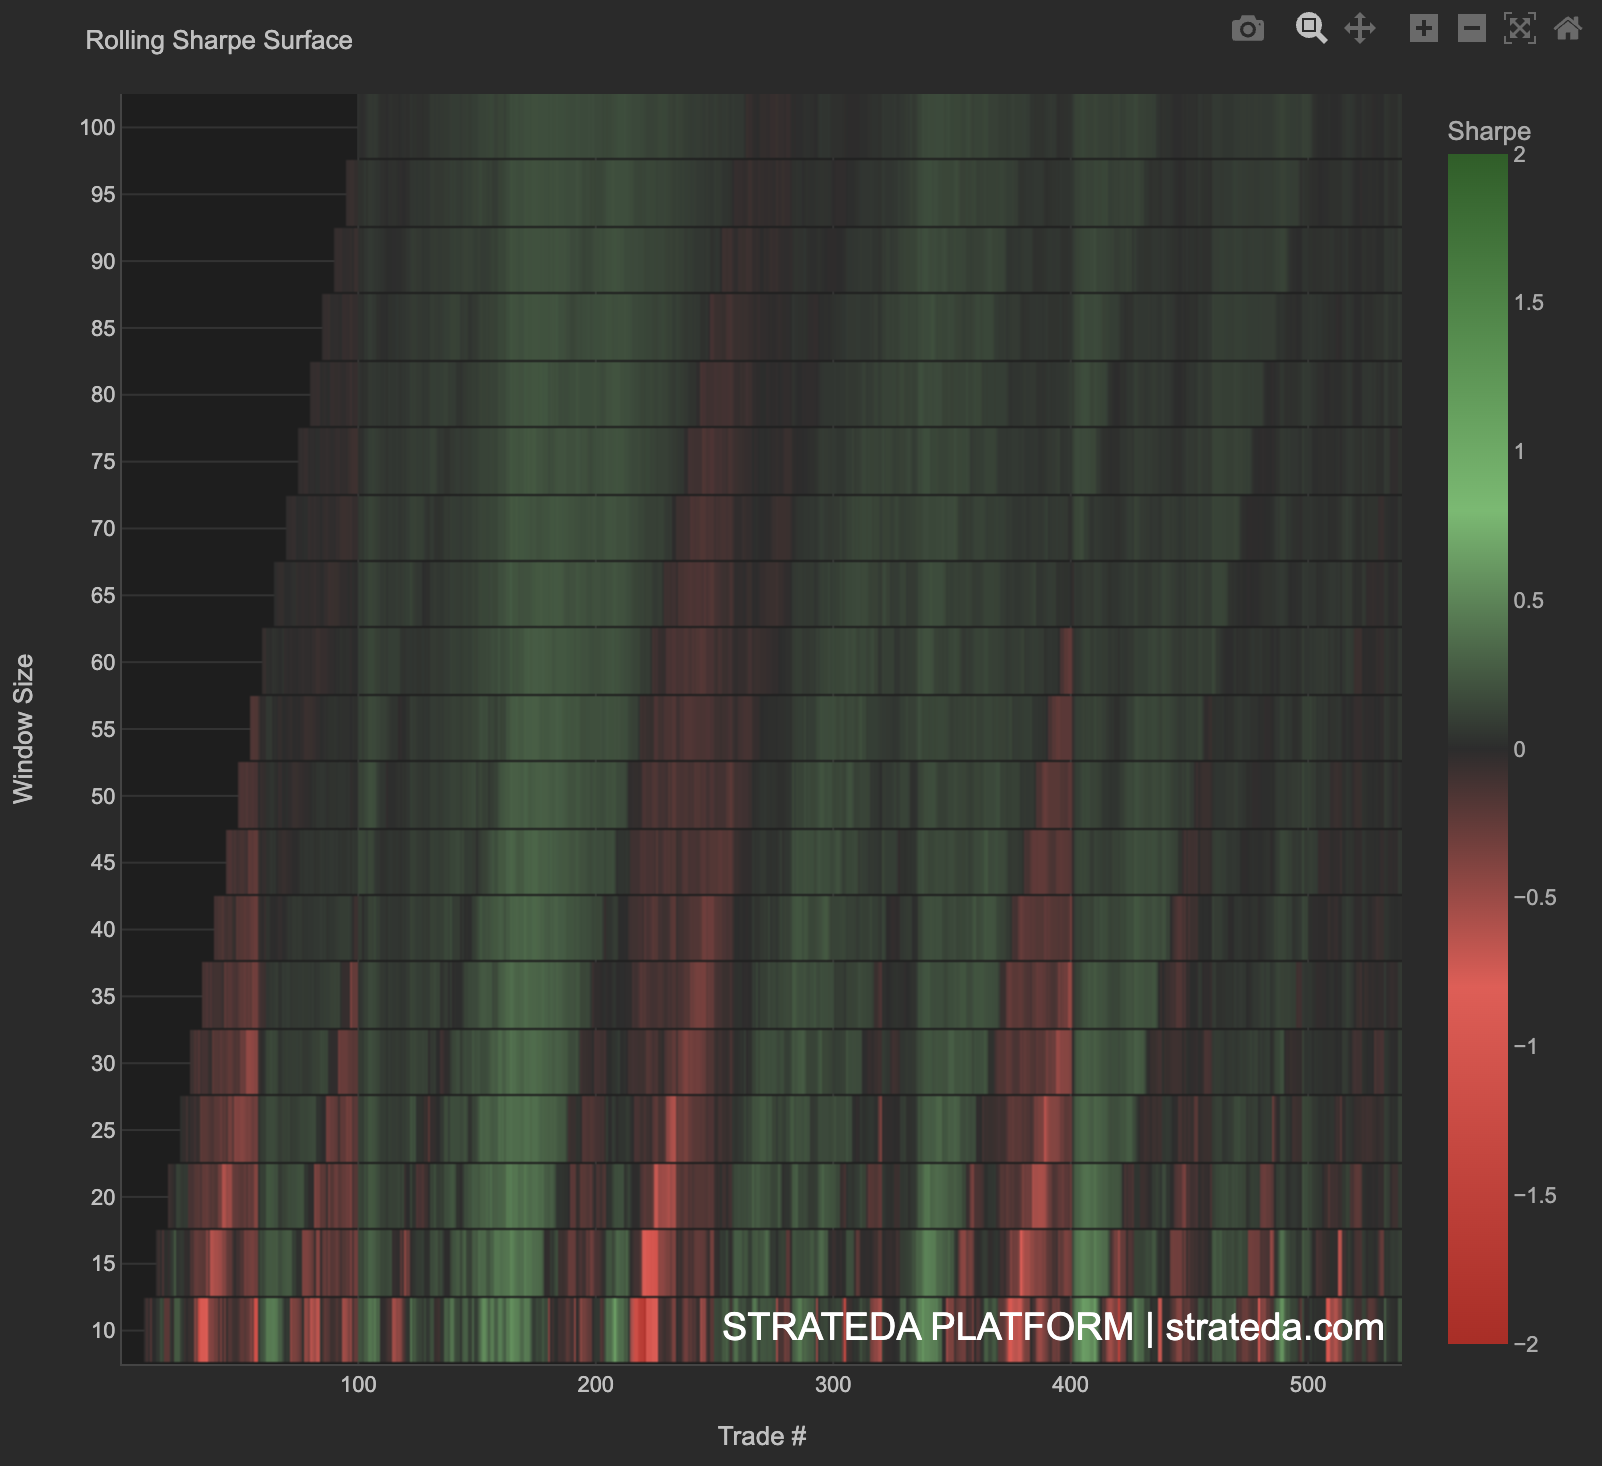
A 2D heatmap where:
- X-axis — Trade number (chronological sequence).
- Y-axis — Rolling window size (number of trades used for Sharpe calculation).
- Cell color — Sharpe ratio for that trade number at that window size. Green indicates high positive Sharpe; red indicates low or negative Sharpe. The color scale runs from approximately −2 (deep red) to +2 (deep green). Values shown are raw (non-annualized) rolling Sharpe ratios. These are not directly comparable to the Rolling Sharpe line chart, which shows annualized values. A raw Sharpe of 0.3 on this surface may correspond to an annualized Sharpe of 1.0–1.5 on the line chart depending on trade frequency.
The result looks like a terrain map. Bright horizontal bands indicate sustained strong performance across all window sizes. Dark vertical bands indicate periods where performance dropped regardless of measurement scale. Diagonal patterns can reveal transitions between regimes.
How to interpret it
Horizontal bright band (consistent across window sizes)
A trade region that shows high Sharpe across all window sizes. This is a period of genuinely strong performance — not a measurement artifact. The strategy's edge was active and consistent during this period.
Vertical dark band (bad period at all scales)
A specific time period where performance dropped regardless of how you measure it. This typically corresponds to a market regime mismatch — a trend period for a range strategy, or a consolidation period for a momentum strategy.
Bright at short windows, dim at long windows
Short-term performance looks good, but when you zoom out to longer windows, the picture is less favorable. This can indicate:
- Recent recovery from a drawdown (short window only sees the recovery).
- High-frequency noise that averages out over longer periods.
Dim at short windows, bright at long windows
Recent short-term performance is weak, but the longer-term picture remains positive. The strategy may be in a temporary rough patch within an overall profitable trajectory.
Regime transitions
A diagonal boundary between bright and dark regions indicates a regime change. The strategy's character shifted at a specific point in time, visible first in short windows and then propagating to longer ones as the new regime persists.
Using the surface for decisions
The surface prevents the most common monitoring mistake: reacting to short-term noise. If a 10-trade rolling Sharpe drops to zero but the 50-trade and 100-trade rolling Sharpe remain positive, the recent dip is noise, not a signal to panic. Conversely, if all scales show deterioration simultaneously, the concern is real.
Example
Rolling Sharpe Surface for 200 trades on EURCHF:
- Trades 1–80, all window sizes: Bright green. Strong performance at every scale.
- Trades 80–110, short windows (10–30): Dark red. Rolling Sharpe drops to near zero.
- Trades 80–110, long windows (50–100): Yellow. Longer windows still show positive Sharpe because they include the strong early period.
- Trades 110–200, all window sizes: Returns to bright green. Recovery is complete across all scales.
Interpretation: The surface confirms the regime dip was temporary and bounded. The long-window resilience during the weak period shows the strategy's overall edge was not destroyed — only temporarily suppressed. The complete recovery across all scales after trade 110 is a strong signal that the edge is intact.