WFO Efficiency Ratio
What it is
The WFO Efficiency Ratio (also called the Walk-Forward Factor) measures how much of the in-sample performance is retained in the out-of-sample period. It's calculated per window as OOS return / IS return, and summarized as an average across all windows. An efficiency ratio of 0.5 means the strategy captured 50% of its training performance on unseen data — half the IS edge was real, half was overfitting.
How to access it
Navigate to the Efficiency tab in the WFO analytics popup. Available on Premium plans.
The WFO analytics popup is accessed via the table icon in the View Panel after your WFO job completes. See The Strategy Panel & View System for full details.
What you see
- Per-window efficiency bars — One bar per window showing the OOS/IS ratio. Bars are color-coded by efficiency level:
- Green — high positive efficiency (well above average line)
- Cyan/Blue — moderate positive efficiency (around or slightly above average line)
- Orange/Yellow — below-average positive efficiency
- Red — negative efficiency (OOS return was negative while IS was positive)
- Orange dashed line — average efficiency across all windows.
- Efficiency ratio value — The overall Walk-Forward Factor displayed as a headline number.
How to interpret it
Overall efficiency
| Walk-Forward Factor | Interpretation |
|---|---|
| Above 1.0 per window | OOS exceeded IS — the strategy performed better on unseen data than training data. Strong positive signal. |
| Above 0.80 | Exceptional — most of the IS edge is real. Verify it's not just favorable OOS conditions. |
| 0.50 – 0.80 | Good — more than half of the IS performance generalizes. Strategy is deployable. |
| 0.30 – 0.50 | Moderate — significant IS-to-OOS degradation, but OOS is still positive. Deployable with caution. |
| 0.10 – 0.30 | Weak — most IS performance was noise. OOS edge is marginal. |
| < 0.10 or negative | No evidence of a real edge. Do not deploy. |
Important nuance: high IS can depress the ratio
A strategy with IS Sharpe of 4.0 and OOS Sharpe of 1.2 has a Walk-Forward Factor of 0.30. That looks low, but an OOS Sharpe of 1.2 is genuinely strong. The ratio is depressed because IS performance was exceptional, not because OOS performance was poor.
Always evaluate absolute OOS performance alongside the efficiency ratio. A "low" ratio with a strong OOS result is better than a "high" ratio with a weak OOS result.
Efficiency above 1.0
When a window's OOS return exceeds its IS return, the efficiency ratio is above 1.0. This is an exceptionally positive outcome — the parameters selected on training data performed even better on unseen data. This can occur when the OOS period's market conditions particularly suit the strategy, or when IS data included difficult periods that suppressed IS metrics.
Do not dismiss high-efficiency windows as suspicious — they are genuine strong OOS results. A single window above 1.0 is notable; multiple windows above 1.0 indicate the strategy concept is genuinely robust and the optimizer is selecting parameters that transfer well to unseen data.
Per-window variation
- Consistent efficiency across windows — The IS-to-OOS relationship is stable. The strategy behaves predictably.
- One or two low-efficiency windows — Likely regime-dependent. If the low-efficiency windows correspond to difficult market conditions, this is expected rather than concerning.
- Highly variable efficiency — The relationship between IS and OOS is unstable. Hard to predict how the strategy will perform going forward.
Example
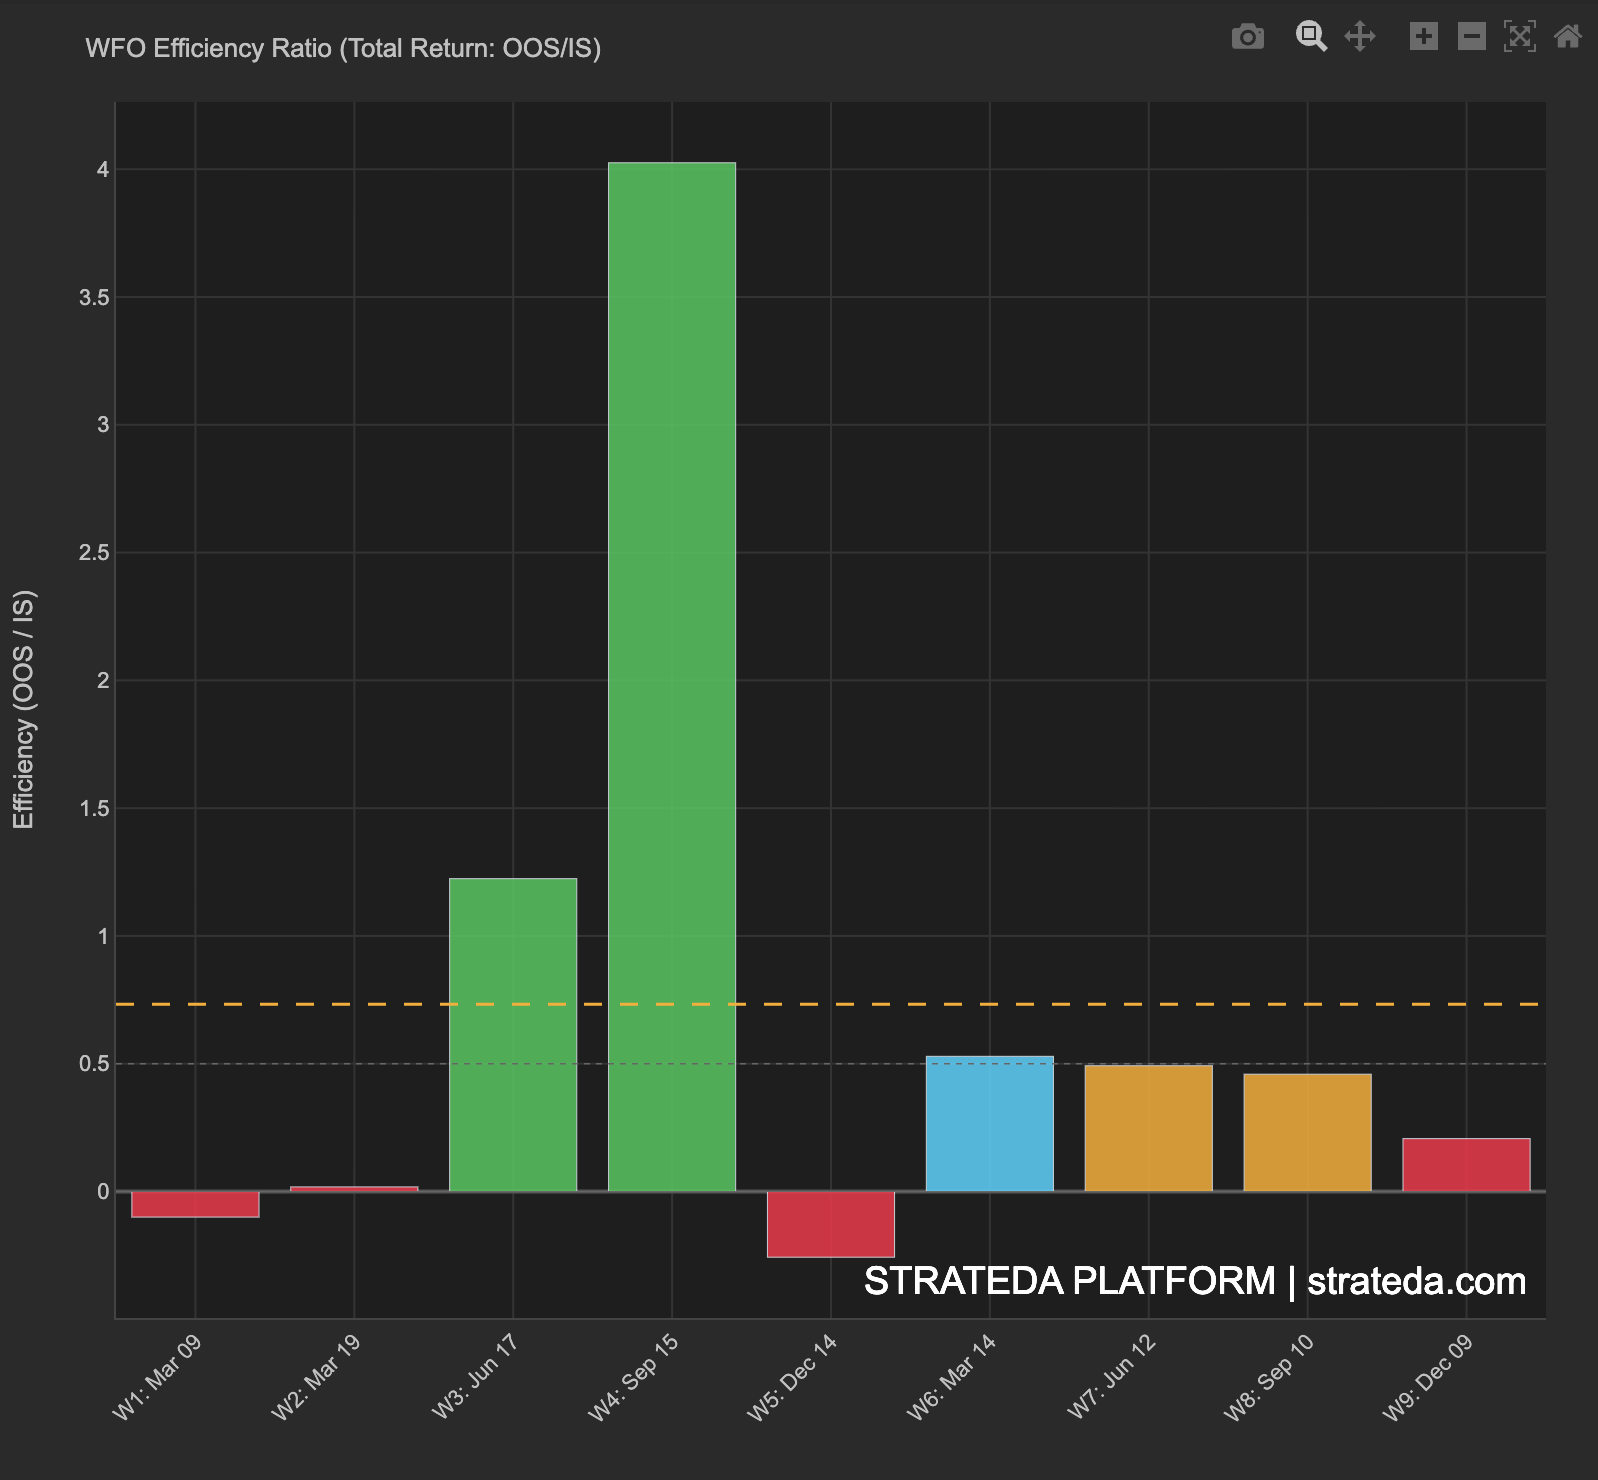
A 9-window WFO for an EMA crossover on EURCHF M30:
| Window | Efficiency | Color | Notes |
|---|---|---|---|
| W1 | −0.45 | Red | OOS was negative — losing window |
| W2 | 0.05 | Orange | Near zero — barely broke even OOS |
| W3 | 1.20 | Green | OOS exceeded IS — strong window |
| W4 | 4.05 | Green | OOS dramatically exceeded IS — best window |
| W5 | −1.60 | Red | OOS was negative — worst window |
| W6 | 0.53 | Cyan | Moderate positive — above breakeven |
| W7 | 0.50 | Orange | Moderate positive — near average |
| W8 | 0.46 | Orange | Moderate positive — near average |
| W9 | 0.20 | Orange | Below average but positive |
Average efficiency: 0.55 (orange dashed line)
Interpretation: The efficiency distribution is wide — ranging from −1.60 (W5) to 4.05 (W4). W4's efficiency of 4.05 means OOS return was more than 4× the IS return for that window. This is not an anomaly to dismiss — it is a genuinely strong OOS result where the optimizer's chosen parameters happened to align with particularly favourable market conditions. W3 also exceeded 1.0, confirming that OOS outperformance is not a one-off.
The two red windows (W1 and W5) had negative OOS returns despite positive IS returns — these are the windows where the edge did not generalise. The remaining 7 windows are all positive, with the average efficiency of 0.55 indicating the strategy retains more than half its IS performance on average. Combined with the absolute OOS returns being positive in 7 of 9 windows, this is a deployable result.