WFO Analytics
What it is
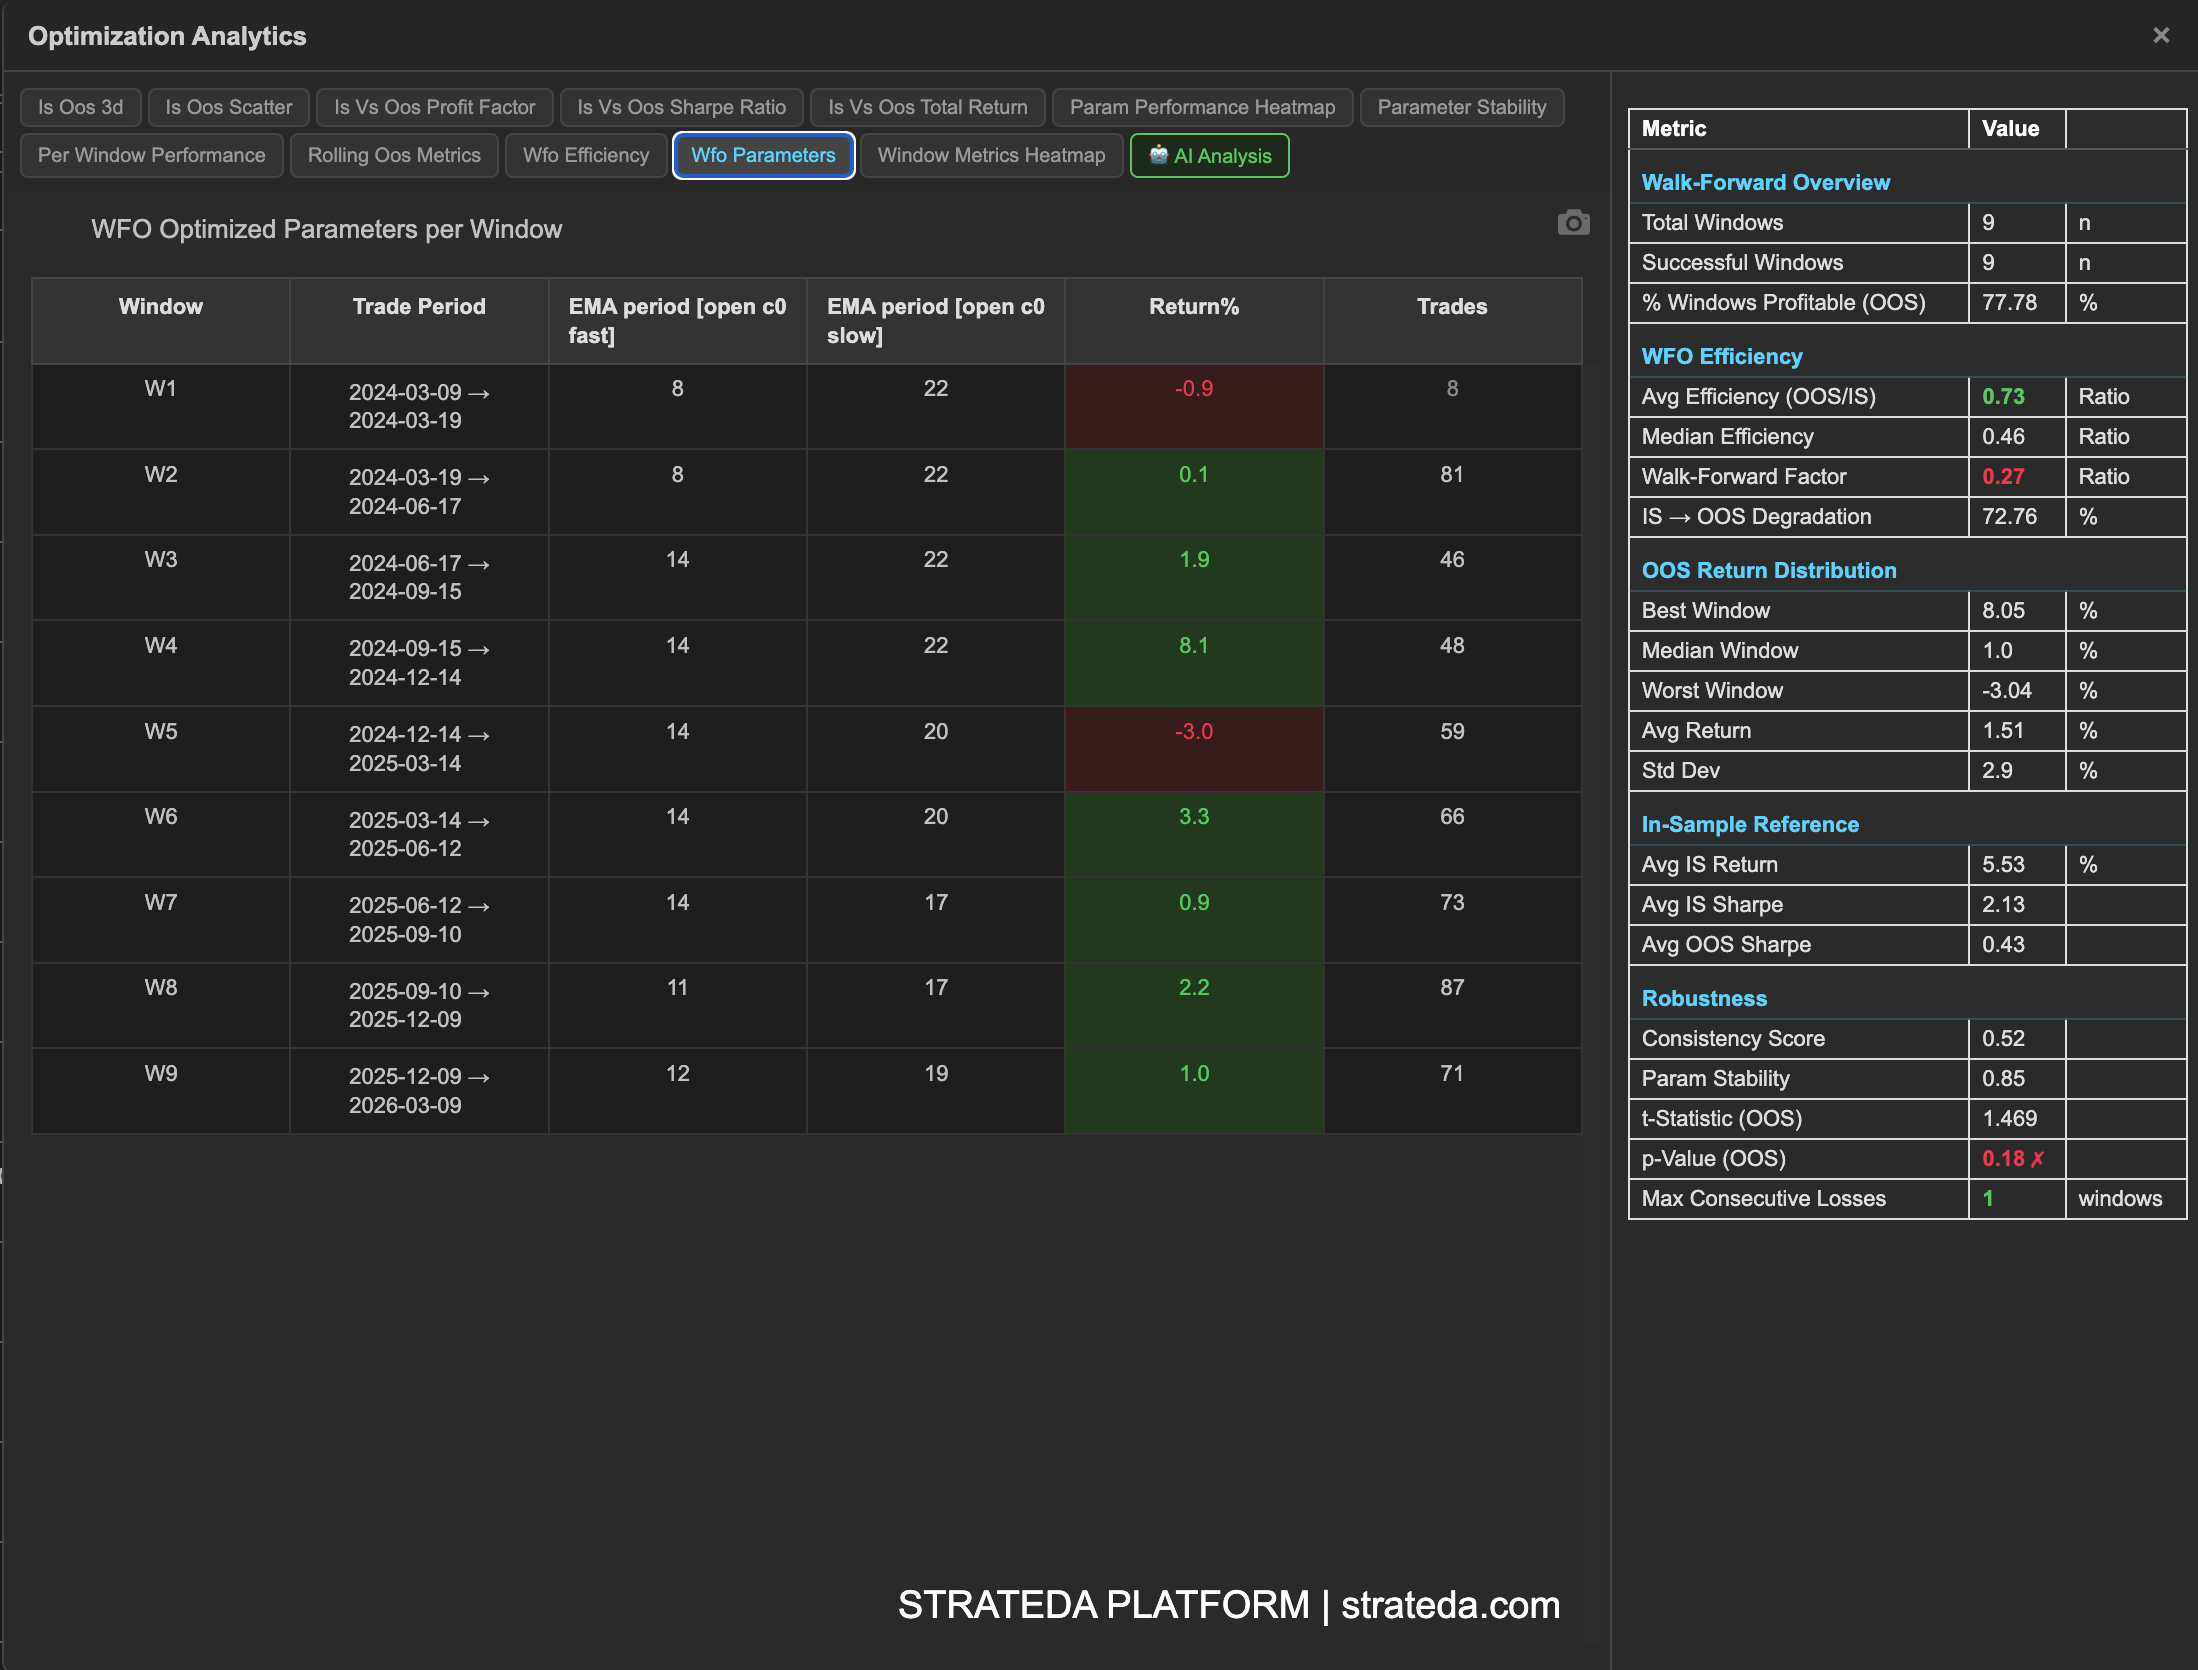
The WFO Analytics popup provides multiple views of your walk-forward optimization results. It opens via the global table icon at the bottom of the View Panel after a WFO job completes. The left panel displays whichever analytics tab is currently selected. The right panel shows the WFO Metrics Reference table at all times, regardless of which tab is active — giving you a persistent reference to aggregate metrics while you explore the visual analytics.
How to access it
When a WFO job completes, the combined out-of-sample equity curve loads automatically in the View Panel.
Two table icons give access to different views:
- Global table icon (at the bottom of the View Panel) — Opens the full WFO analytics popup with all tabs and the persistent WFO Metrics Reference table on the right.
- Local table icon (on the individual equity curve entry in the View Panel) — Opens the single backtest metrics popup for that specific WFO result — the same metrics view as a regular backtest.
For full details on how the table icons work across different result types, see The Strategy Panel & View System.
Available on Premium plans.
What you see
The analytics popup is organised into tabs, each covering a different dimension of walk-forward quality:
| Tab | What it reveals |
|---|---|
| WFO Parameter Table | Parameters selected per window with OOS return and trade counts |
| IS vs OOS Return | In-sample vs out-of-sample return comparison per window |
| IS vs OOS Scatter | IS vs OOS return scatter with efficiency lines |
| IS vs OOS 3D | Interactive 3D view of IS/OOS returns across windows |
| IS vs OOS Profit Factor & Sharpe | Profit factor and Sharpe ratio comparison per window |
| Per-Window OOS Performance | OOS return per window with cumulative overlay |
| WFO Efficiency Ratio | OOS/IS efficiency ratio per window |
| Parameter Stability | Selected parameter values tracked across windows |
| OOS Metrics Heatmap | All OOS metrics normalised across windows |
| Rolling OOS Performance | Cumulative average OOS return and profit factor |
| Parameter Performance Heatmap | Parameter choices vs OOS metrics heatmap |
How to interpret it
Start with the WFO Metrics Reference table on the right — it gives the GO/NO-GO signal before diving into individual views. Then use the IS vs OOS Return comparison to see per-window degradation, and the Parameter Stability chart to confirm the optimizer is finding consistent signals.
The remaining views provide targeted insights:
- Use IS vs OOS Scatter to identify efficiency patterns and outlier windows
- Use Per-Window OOS Performance to see the sequence of OOS results over time
- Use OOS Metrics Heatmap for a normalised cross-view of all metrics simultaneously