IS vs OOS Profit Factor
What it is
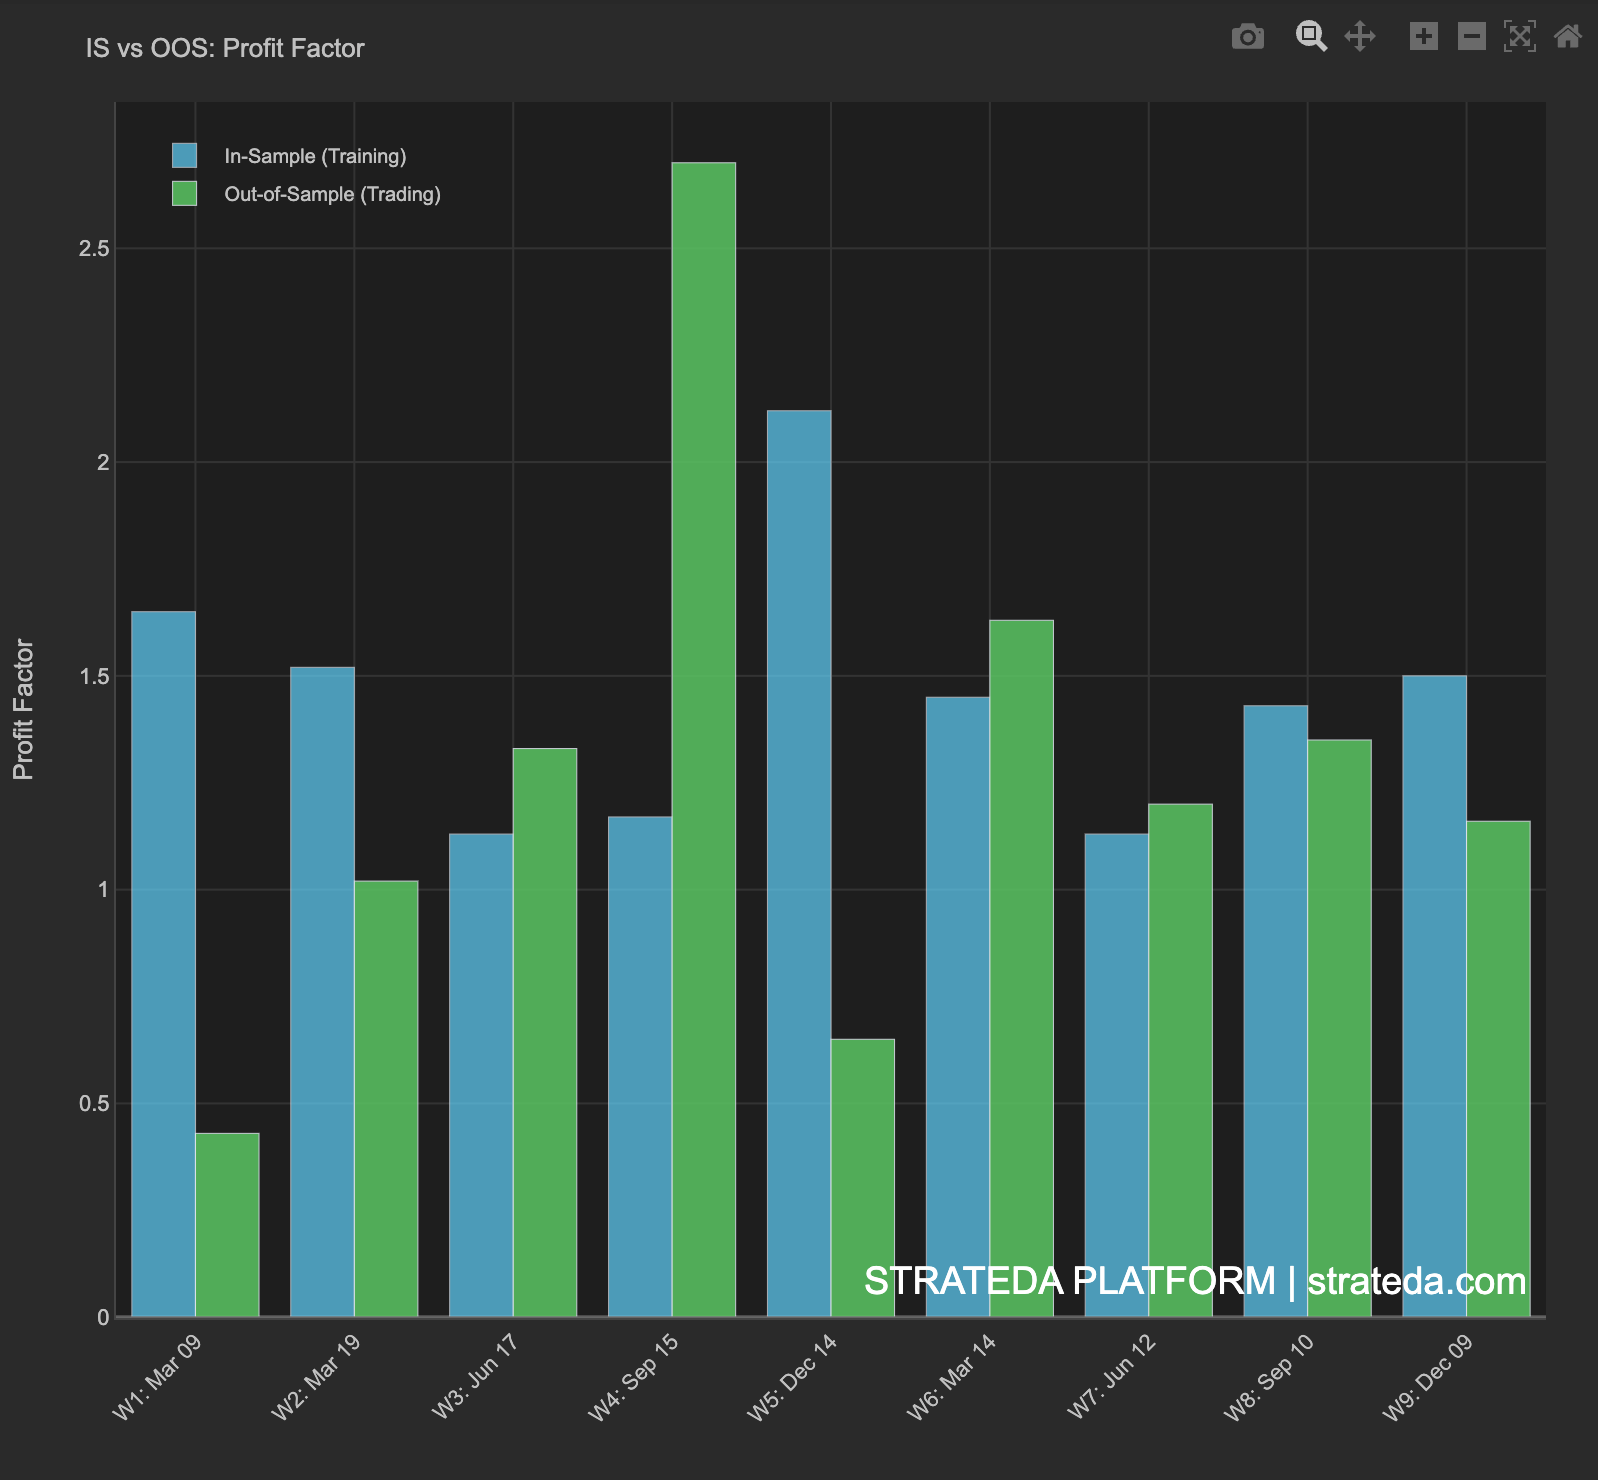
This view shows the in-sample and out-of-sample profit factor side by side for each walk-forward window. Profit factor (gross profit divided by gross loss) is a more stable metric than Sharpe at lower trade counts, making it a reliable quality check across windows. The IS vs OOS Sharpe Ratio comparison is available as a separate tab.
Comparing profit factor between IS and OOS periods reveals whether the strategy's win/loss quality survives contact with unseen data — not just whether it made money, but whether it made money efficiently.
How to access it
Navigate to the IS vs OOS Profit Factor tab in the WFO analytics popup. Available on Premium plans.
The WFO analytics popup is accessed via the table icon in the View Panel after your WFO job completes. See The Strategy Panel & View System for full details.
What you see
A paired bar chart with one pair of bars per window:
- Blue bars — In-Sample (Training) profit factor per window.
- Green bars — Out-of-Sample (Trading) profit factor per window.
- Breakeven line at PF = 1.0 — above is profitable, below is not.
- X-axis — Windows arranged chronologically with date labels.
How to interpret it
Profit factor patterns
- OOS PF consistently above 1.0 — The strategy wins more than it loses out-of-sample, after accounting for the magnitude of wins and losses. Strong signal.
- OOS PF between 1.0 and IS PF — Normal degradation. The edge is real but smaller than in training.
- OOS PF below 1.0 in most windows — The strategy is not reliably profitable out-of-sample.
OOS exceeding IS (efficiency above 1.0)
Occasionally an OOS window outperforms its corresponding IS window — the green bar is taller than the blue bar. This means the optimizer's chosen parameters performed better on unseen data than on training data. This is a strong positive signal.
It can occur when the OOS period happens to align with the strategy's ideal market conditions, or when the IS period included difficult market conditions that suppressed IS metrics. A single window with OOS exceeding IS is notable; multiple windows showing this pattern indicate the strategy concept is genuinely robust.
Example
A 9-window WFO for an EMA crossover on EURCHF M30:
| Window | IS PF | OOS PF |
|---|---|---|
| W1 | 1.12 | 0.85 |
| W2 | 1.18 | 1.02 |
| W3 | 1.45 | 1.38 |
| W4 | 1.52 | 2.68 |
| W5 | 1.88 | 0.42 |
| W6 | 1.74 | 1.55 |
| W7 | 1.62 | 1.18 |
| W8 | 2.05 | 1.42 |
| W9 | 1.91 | 1.22 |
Interpretation: IS PF ranges from 1.1 to 2.1 — consistently above breakeven. OOS PF is above 1.0 in 7 of 9 windows. W4 is notable — OOS PF of 2.68 significantly exceeds its IS PF of 1.52, meaning the optimizer's chosen parameters performed better on unseen data than on training data. This is a strong positive signal for that window's market conditions. W5 is the weakest window at OOS PF 0.42 — a significant loss period. Cross-reference with the Parameter Stability chart to check whether W5's parameters differed from the stable range.