Per-Window OOS Performance
What it is
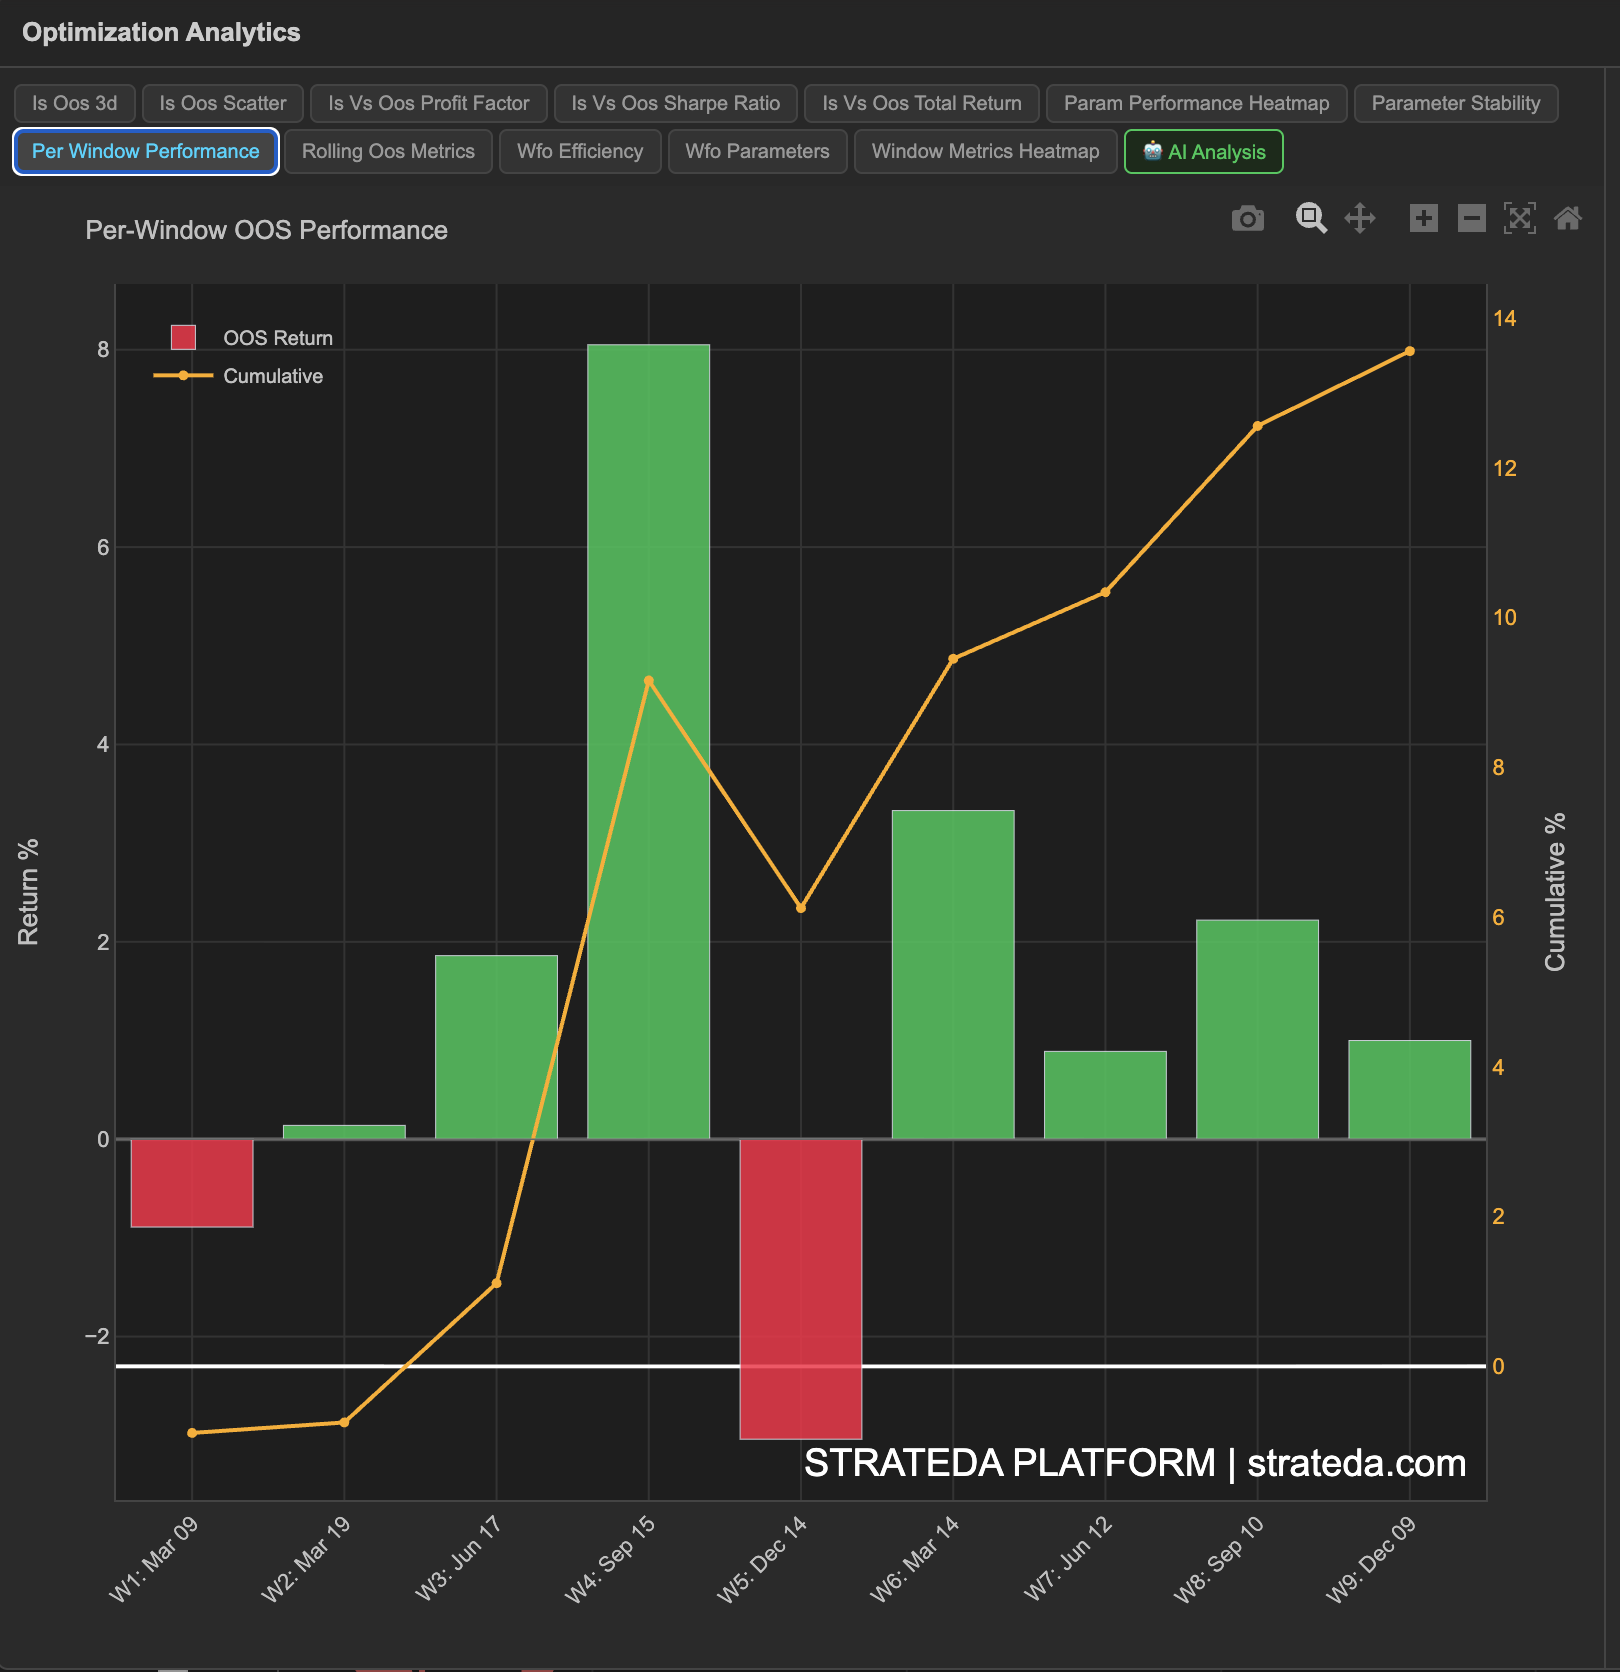
This chart focuses exclusively on out-of-sample results — the data that matters most. It shows the OOS return for each individual window as a bar (green for positive, red for negative), with a cumulative line overlay tracking the running total across all windows. This is the closest representation of how the strategy would have performed if you had deployed it in real time, re-optimizing at each window boundary.
How to access it
Navigate to the Per-Window OOS tab in the WFO analytics popup. Available on Premium plans.
The WFO analytics popup is accessed via the table icon in the View Panel after your WFO job completes. See The Strategy Panel & View System for full details.
What you see
- Individual OOS return bars — One bar per window, colored green (profitable) or red (losing). The height represents the return percentage for that window.
- Cumulative line — A line tracking the running sum of all OOS returns from window 1 to the last window. This shows the net forward-tested performance over the full WFO period.
- Windows are arranged chronologically on the x-axis.
How to interpret it
Individual bars
- Mostly green — The strategy is profitable out-of-sample more often than not. Greater than 60% green windows is a positive signal.
- Mix of green and red — Some regime dependency. Check whether the red bars cluster in specific time periods.
- Mostly red — The strategy fails out-of-sample. Optimization is fitting noise, not signal.
Cumulative line
The shape of the cumulative line tells you about the strategy's trajectory:
- Steadily rising — Consistent OOS profitability across windows. The strongest result possible.
- Rising with pullbacks — Overall positive, with intermittent losing windows. Normal for regime-dependent strategies.
- Flat — Wins and losses roughly cancel out. The strategy has no net edge out-of-sample.
- Declining — Cumulative OOS is negative. The strategy is a net loser on unseen data despite optimization.
Consecutive losing windows
Pay attention to sequences:
- 1 losing window surrounded by winners — Likely a temporary regime mismatch. Normal.
- 2 consecutive losing windows — Worth investigating. What market conditions prevailed? Is this a regime the strategy doesn't handle?
- 3+ consecutive losing windows — Strong red flag. Either the strategy concept is flawed or the market has structurally changed.
Example
A 7-window WFO for a DEMA/EMA crossover on EURCHF:
| Window | OOS Return | Cumulative |
|---|---|---|
| 1 | +1.8% (green) | +1.8% |
| 2 | +2.1% (green) | +3.9% |
| 3 | −0.4% (red) | +3.5% |
| 4 | +0.6% (green) | +4.1% |
| 5 | +1.5% (green) | +5.6% |
| 6 | +2.3% (green) | +7.9% |
| 7 | +1.1% (green) | +9.0% |
The cumulative line rises steadily with only a minor dip at Window 3. The single red bar doesn't interrupt the upward trajectory. Net forward-tested performance across 3.5 years of OOS data is +9.0%, all achieved on data the optimizer never saw. This is a strong validation of the strategy concept.