Parameter Stability Across Windows
What it is
Parameter Stability tracks how the optimizer's selected parameter values change from one walk-forward window to the next. This is one of the most important WFO diagnostics. If the optimizer consistently finds similar parameters across different time periods, it's finding the same underlying market pattern each time. If parameters jump randomly, the optimizer is chasing noise — each window's "best" combination is different because there is no persistent pattern to find.
How to access it
Navigate to the Parameter Stability tab in the WFO analytics popup. Available on Premium plans.
The WFO analytics popup is accessed via the table icon in the View Panel after your WFO job completes. See The Strategy Panel & View System for full details.
What you see
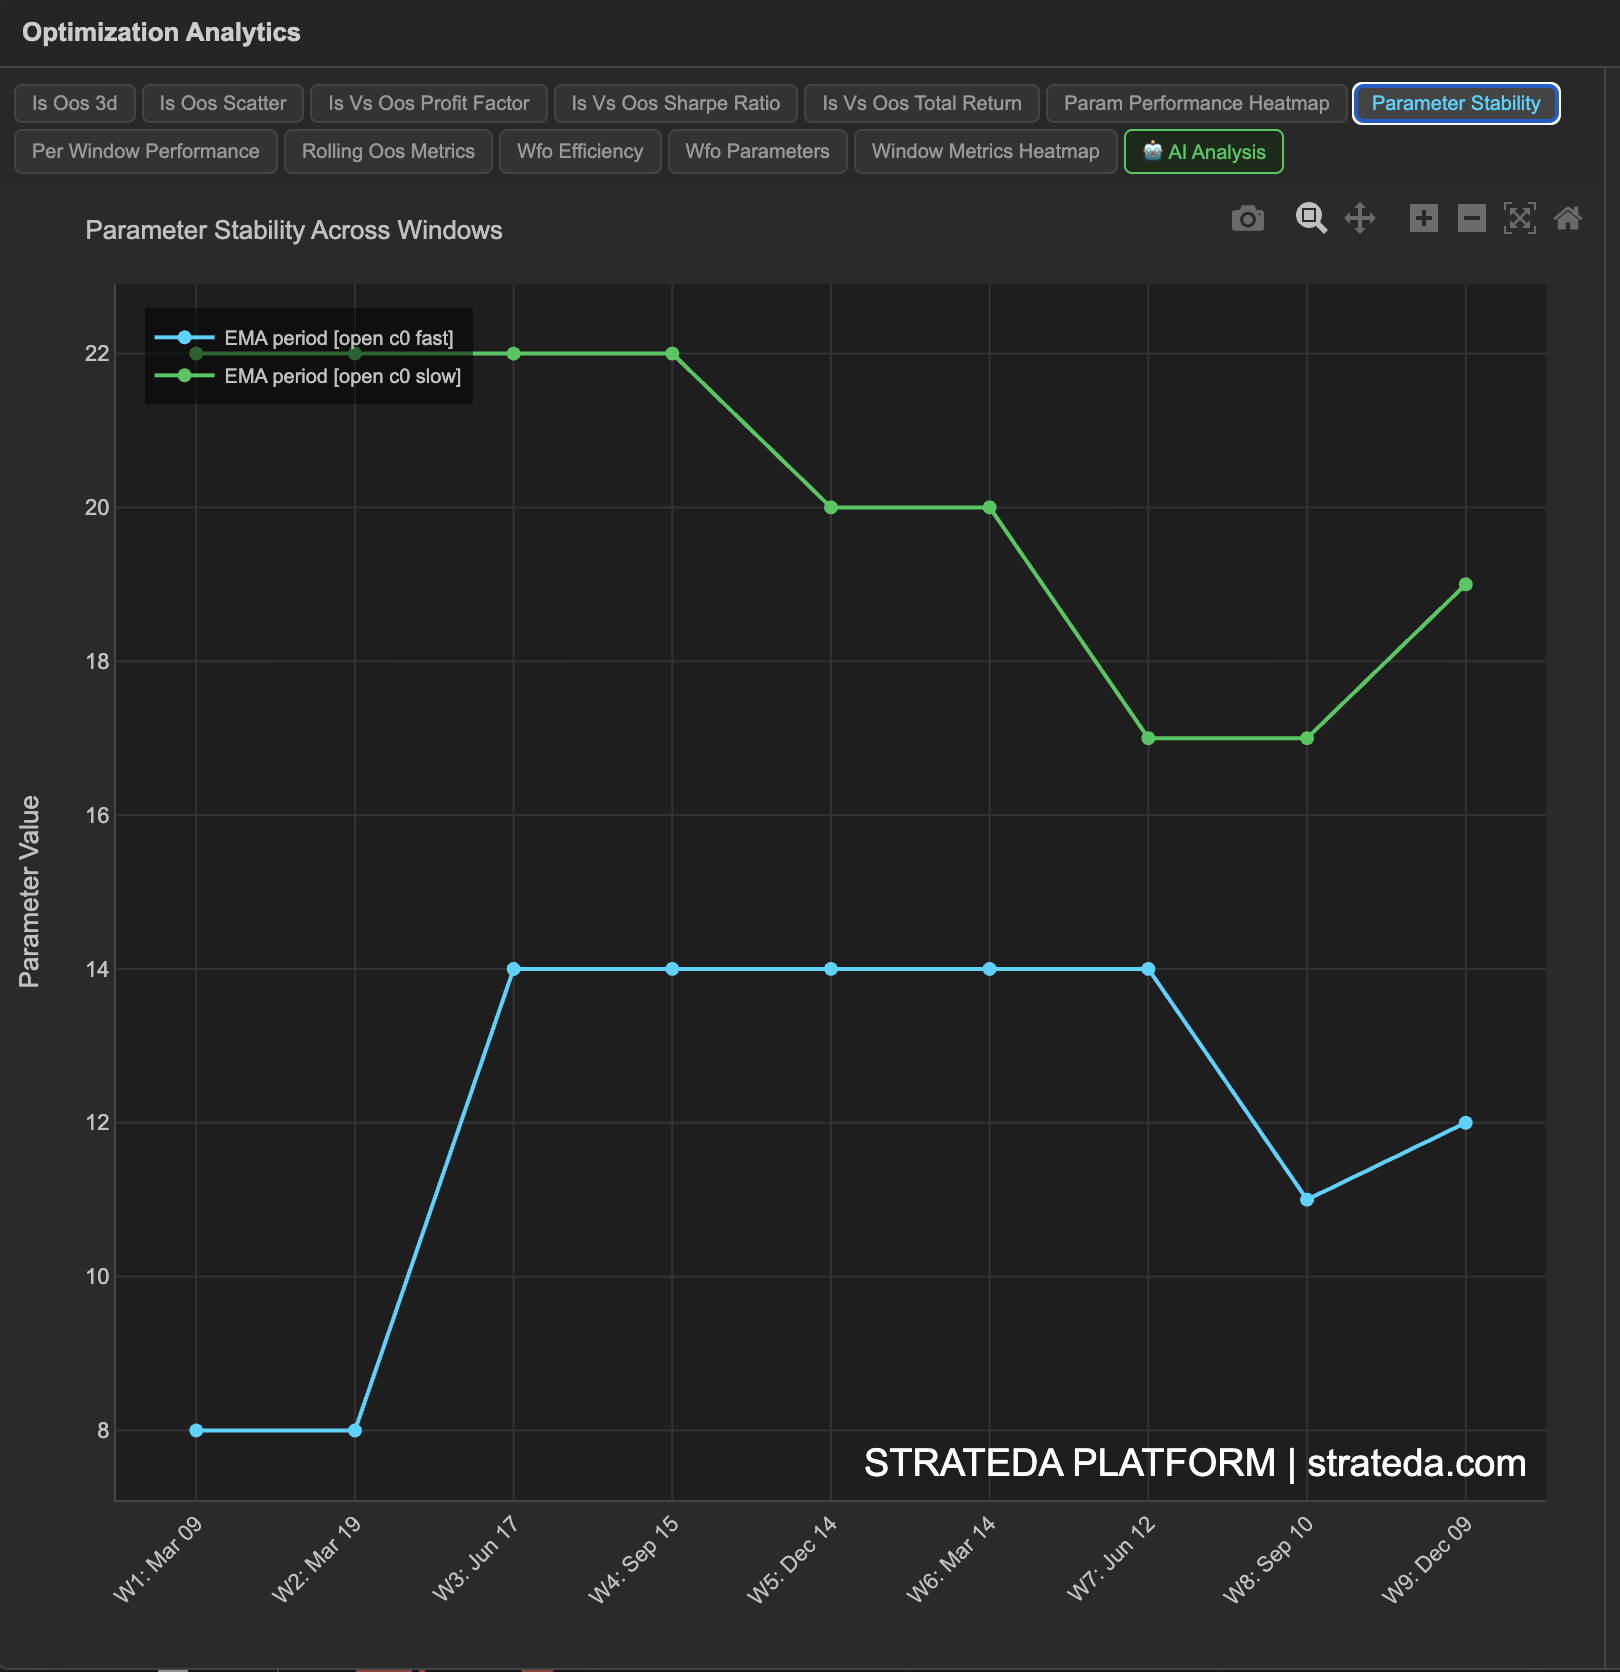
A multi-line chart with:
- X-axis — Window number (chronological).
- Y-axis — Parameter value.
- One line per optimized parameter — Each line tracks how that parameter's selected value changes across windows (e.g., EMA period plotted across all 7 windows, DEMA period plotted as a second line).
If you have two optimized parameters, you'll see two lines. If the lines are relatively flat, the parameters are stable.
How to interpret it
Stability patterns
Flat lines (high stability): Both parameter lines stay within a narrow range across all windows — for example, EMA stays between 18 and 28 for all 7 windows. This is the ideal result. The optimizer is finding the same signal structure in every time period, which is strong evidence that the market pattern is persistent.
Gradual drift: Parameters shift steadily in one direction — for example, EMA increases from 20 to 35 over 7 windows. This suggests the market's characteristic timescale is changing. The strategy is adapting, which is acceptable, but you should understand the underlying cause (e.g., decreasing volatility often requires longer lookback periods).
Random jumps (low stability): Parameters show no pattern — EMA might be 10, then 55, then 25, then 60. The optimizer is fitting to noise in each window. This is a strong signal that the strategy concept does not capture a persistent market pattern on this instrument.
Convergence: Parameters start scattered but converge toward a consistent range in later windows. This could indicate that earlier windows included a different market regime, and the strategy works better in more recent conditions.
Stability score
Strateda computes a parameter stability score (0 to 1) summarizing the consistency across windows:
| Stability Score | Interpretation |
|---|---|
| > 0.75 | Highly stable — parameters are consistent across windows |
| 0.50 – 0.75 | Moderately stable — some variation but within a range |
| < 0.50 | Unstable — parameters vary significantly between windows |
Why stability matters for live deployment
When you deploy a strategy live, you're using the parameters from the most recent optimization. If parameters are stable, you have confidence that next month's optimal parameters will be similar to this month's. If parameters are unstable, you have no basis for expecting current parameters to remain optimal — each month brings a random new set, and you're always running last month's (already outdated) parameters.
Example
Parameter stability for a DEMA/EMA crossover on EURCHF M30 across 7 windows:
| Window | DEMA | EMA |
|---|---|---|
| 1 | 22 | 20 |
| 2 | 24 | 22 |
| 3 | 26 | 24 |
| 4 | 24 | 20 |
| 5 | 22 | 18 |
| 6 | 20 | 18 |
| 7 | 22 | 20 |
Stability score: 0.82. Both lines stay within a 6-unit range (DEMA: 20–26, EMA: 18–24). There's a slight upward drift in windows 1–3 followed by a return to baseline — consistent with EURCHF's shift from a trending to a ranging regime in 2024. The strategy's optimal parameters correspond to the same approximate characteristic timescale across all conditions.
This level of stability means the trader can deploy with confidence that the current parameters will remain relevant.