Equity Curve Fan
What it is
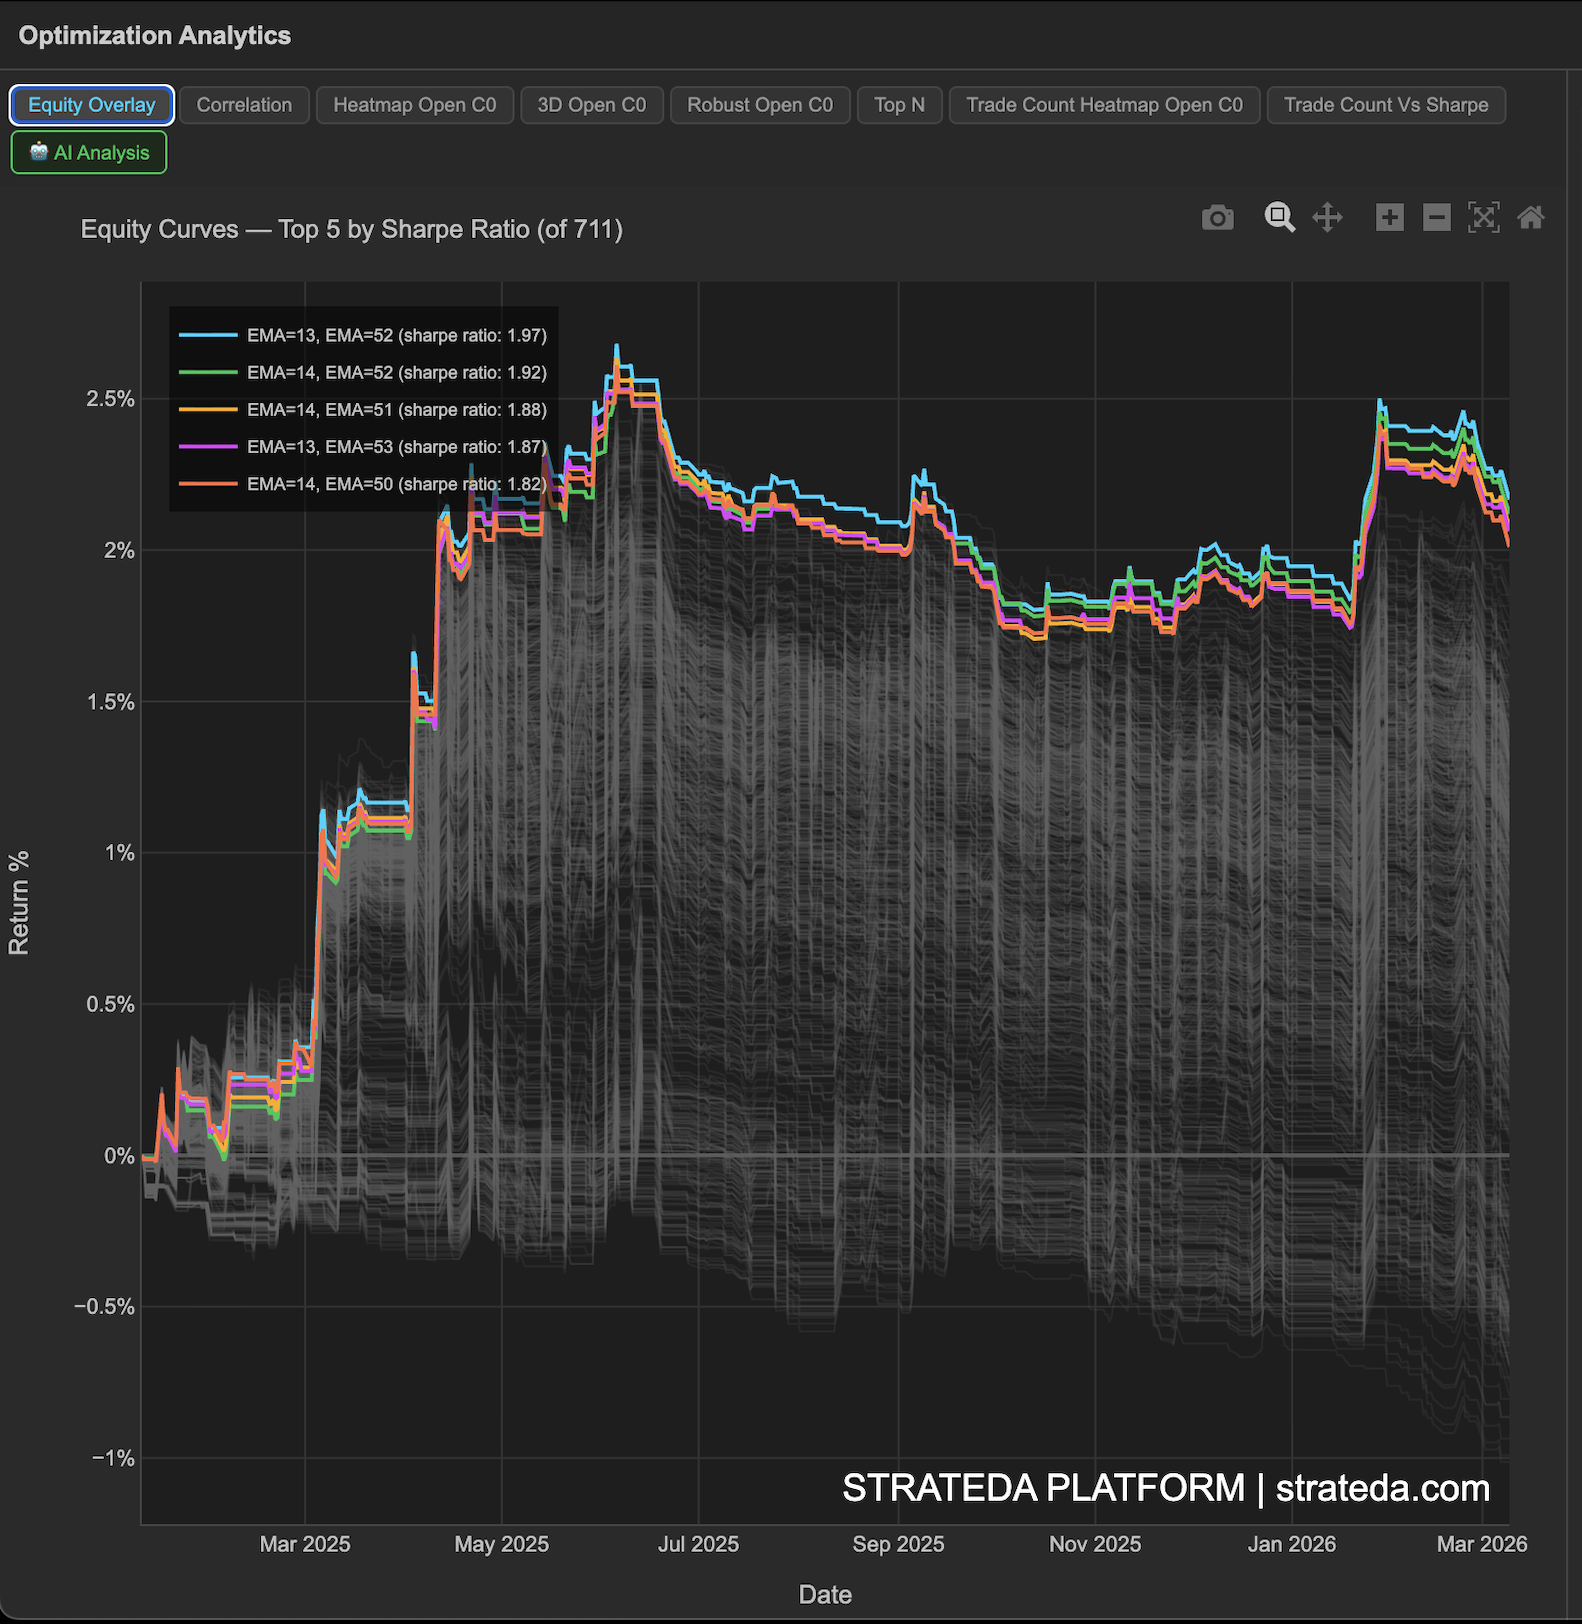
The Equity Curve Fan plots the equity curve of every parameter combination from your optimization on a single chart. This gives you an immediate visual picture of the full range of outcomes — from the best-performing combinations to the worst — and how they evolve over time. It answers a question that summary statistics alone cannot: "Do the good combinations perform consistently, or did they get lucky on a few trades?"
How to access it
Navigate to the Equity Curve Fan tab in the optimization analytics popup. Available on Plus plans and above.
The optimization analytics popup is accessed via the table icon in the View Panel after your optimization job completes. See The Strategy Panel & View System for full details.
What you see
The chart displays one equity curve per parameter combination, all sharing the same time axis:
- Top-N combinations are highlighted in distinct colors so you can track them individually.
- All other combinations are rendered in semi-transparent gray, forming the "fan" shape that shows the distribution of outcomes.
- The x-axis represents time (the backtest period).
- The y-axis represents account value or cumulative return.
The overall shape of the fan tells you how much variation exists across parameter choices. A narrow fan means performance is relatively stable regardless of parameters. A wide fan means parameter choice matters significantly.
How to interpret it
Signs of a robust strategy:
- The top combinations (colored lines) sit comfortably above the gray mass — they're not just marginally better.
- The colored lines trend upward consistently without large drawdown periods that the gray lines avoid.
- Most gray lines are at least flat or slightly positive — the majority of parameter choices produce reasonable results.
Warning signs:
- The colored lines spike sharply at specific points — performance may be driven by a few outlier trades rather than a consistent edge.
- The gray mass is heavily negative with only a few colored lines above zero — most parameter choices lose, and the "best" parameters may be overfitting.
- Equity curves cross frequently — no parameter set is consistently better, suggesting the strategy doesn't have a stable edge.
What to look for over time:
- Do the top combinations pull away steadily, or do they jump ahead during one period and flatline after? Steady separation is more trustworthy.
- Are there periods where all curves decline together? That suggests a regime where the strategy concept fails regardless of parameters.
Example
An optimization of 400 EMA crossover combinations on BTCUSD produces a fan chart where:
- The top 5 combinations (colored) show steady upward trends with moderate drawdowns.
- About 60% of the gray lines are above the starting value — most parameter choices at least break even.
- One period in mid-2023 shows all curves declining — a regime where crossover strategies underperformed across the board.
The trader notes that the top combinations recovered from the drawdown and continued trending up, while many gray lines did not. This suggests the winning parameter regions have a genuine, if not universal, edge.