Slippage Cost as % of Margin
What it is
This chart expresses slippage not in price units but as a percentage of the margin required for each trade. This normalises execution cost relative to capital committed per trade — a slippage of 50 price units means something very different on a 5,000 margin trade. The denominator is the broker margin required to open that specific trade, falling back to total account margin in use if per-trade margin is unavailable. By viewing slippage as % of margin, you get a directly comparable cost metric across different instruments, position sizes, and market conditions.
This matters because raw slippage numbers are meaningless without context. A strategy trading BTCUSD with 5,000 margin trade is only 1%. This view makes that distinction visible and quantifiable.
How to access it
Navigate to Slippage Cost / Margin in the Execution Quality dashboard. Available on Pro and Premium plans. Requires live trade data from an MT5-deployed strategy.
What you see
- X-axis — Time (UTC) — trades displayed in chronological order.
- Y-axis — Slippage Cost / Margin (%) — total slippage for each trade expressed as a percentage of the margin required to open that trade.
- Green dots — Entry slippage cost as % of margin (one dot per entry fill).
- Red dots — Exit slippage cost as % of margin (one dot per exit fill).
- Blue horizontal line — Mean slippage cost across all trades, providing the baseline.
- Title — Shows the overall mean percentage (e.g., 5.763%).
The dot count may differ between entries and exits — entries are recorded at trade open, exits at trade close. Trades still open at the time of loading will have entry dots but no corresponding exit dots.
How to interpret it
Cost thresholds
| Mean Slippage / Margin | Assessment |
|---|---|
| < 5% | Low — execution cost is a small fraction of capital committed per trade. Acceptable for most strategies. |
| 5–10% | Moderate — monitor closely for strategies with tight profit targets. A 7% cost on margin means your trade needs to generate at least 7% margin-relative return just to break even on execution. |
| > 10% | High — slippage may be meaningfully eroding strategy returns. Review broker conditions, execution timing, and whether the strategy's edge is large enough to absorb this cost. |
Patterns to watch
Scatter with no time trend: Execution cost is stable over time — not drifting upward or downward. This is the expected pattern and indicates consistent broker execution quality.
Upward drift over time: Execution costs are increasing. Possible causes include deteriorating market liquidity, broker changes, or the strategy entering more volatile conditions as parameters drift.
Outlier dots far above the mean: Extreme slippage events on specific trades. Cross-reference the timestamps with the Temporal Slippage Patterns chart to identify whether these outliers cluster during low-liquidity periods or around news events.
Exits (red) consistently higher than entries (green): Your exit conditions may be triggering during volatile moments. Crossover exits during strong momentum moves and stop-loss fills during fast price action both produce higher slippage than planned entries. If the gap is significant, consider whether ATR-based exits or wider stop losses would reduce exit slippage.
Entries (green) consistently higher than exits (red): Your entry signals fire during momentum — natural for crossover-based strategies where you enter as price moves through a level. This is a market microstructure effect, not a broker issue.
Cross-reference high slippage cost % outliers with the Temporal Slippage Patterns chart — outliers often cluster during low-liquidity periods where both slippage and margin efficiency are worst.
Why this metric matters
A strategy with tight stop losses and small profit targets is far more sensitive to slippage cost as % of margin than a trend-following strategy with wide targets. If your average trade captures 3% of margin in profit but costs 5% of margin in slippage, execution is consuming more than your edge — the strategy is structurally unprofitable despite positive signal quality.
This view lets you quantify whether execution cost is a material drag on your specific strategy's edge, independent of position size or instrument. It is the single best metric for answering: "Is slippage actually hurting me, or is it just noise?"
Example
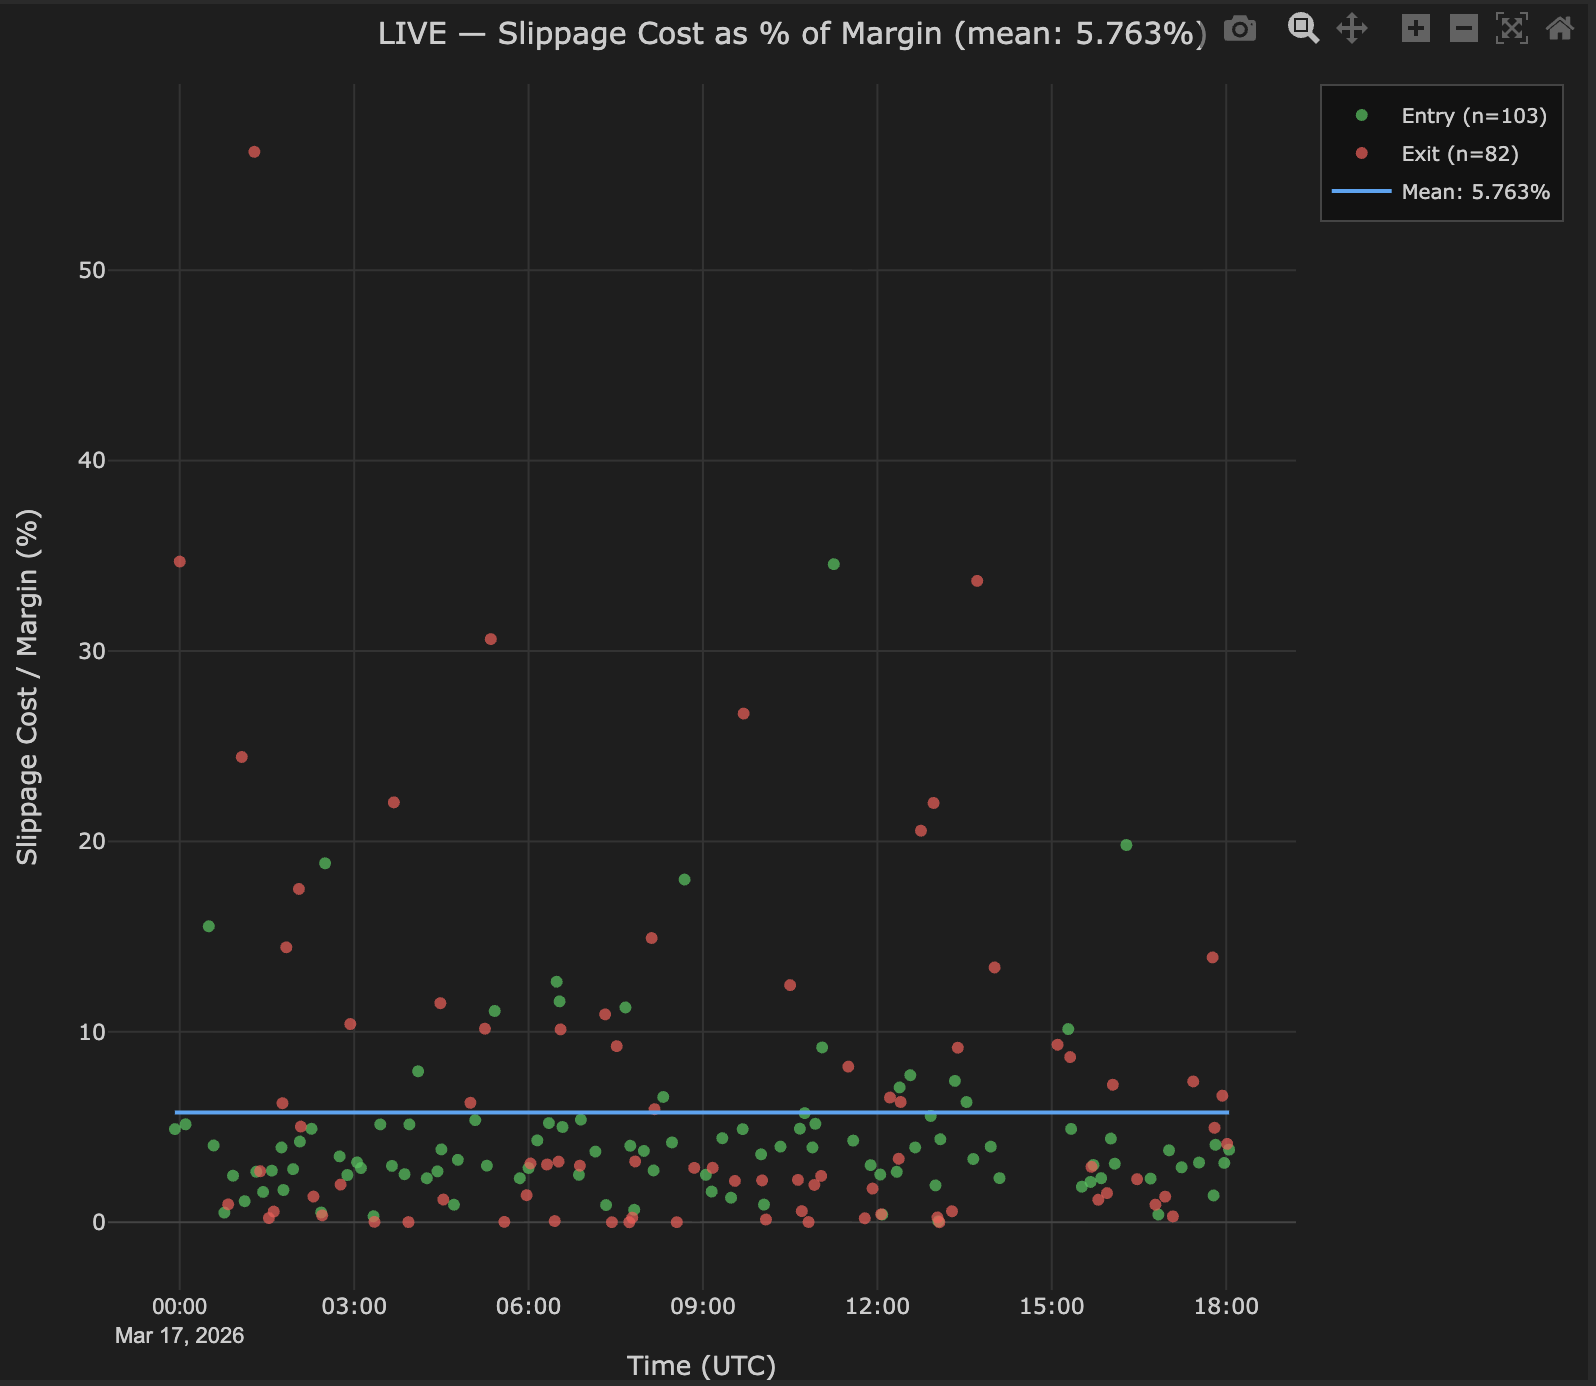
Slippage cost as % of margin for 103 entries and 82 exits on a BTCUSD live strategy:
- Mean slippage / margin: 5.763% (blue line).
- Entry dots (green): Clustered between 2–8%, with a few outliers at 12–15%.
- Exit dots (red): Slightly wider spread than entries, clustered between 3–10%.
- No visible time trend — costs are stable across the 3-month period.
- Three outlier exits above 15% — all occurring during weekend hours (Saturday 02:00–04:00 UTC).
Interpretation: The 5.76% mean is moderate. For this BTCUSD strategy with an average trade return of 12% of margin, slippage consumes roughly half of the per-trade edge — significant but not fatal. The weekend outliers are consistent with thin crypto liquidity during Saturday early hours. Restricting exit signals during weekend low-liquidity windows could reduce mean slippage cost to approximately 4.5%, improving net strategy returns by roughly 1.2% of margin per trade.