Latency vs Slippage
What it is
This chart shows the relationship between Strateda signal delivery latency and trade slippage. Note that latency here measures signal arrival time at MT5 — broker execution speed is a separate factor. A weak or no correlation between latency and slippage is the expected healthy result, indicating your broker executes independently of signal delivery timing.
Intuitively, you might expect slower signal delivery to produce worse slippage — the market may move while the signal is in transit. But this isn't always the case, and the actual relationship in your data tells you something important about your execution environment.
How to access it
Navigate to Latency vs Slippage in the Execution Quality dashboard. Available on Pro and Premium plans.
What you see
A 2D contour density plot where:
- X-axis — Execution Latency (ms).
- Y-axis — |Slippage| in price units — absolute slippage value, showing magnitude regardless of direction.
- Contours/density — Color-coded density showing where most data points cluster. Dense regions (warm colors) indicate common latency-slippage combinations; sparse regions (cool colors) indicate rare combinations.
- Correlation coefficient (r) — Displayed in the top right corner with a plain-English label (None / Weak / Moderate / Strong). This is the Pearson correlation between latency and absolute slippage across all trades.
Each point in the density represents one trade execution, positioned by its latency and absolute slippage values. The contour approach is used instead of a scatter plot because individual points overlap heavily — the density view reveals the true pattern.
How to interpret it
No relationship (circular or horizontal cluster)
The density cluster is centered and roughly circular, or stretches horizontally without a vertical tilt. Slippage doesn't depend on latency — fast and slow fills produce similar slippage outcomes.
What it means: When r is labelled None or Weak (typically r < 0.3), signal delivery time is not a significant driver of slippage. Slippage is determined by broker execution factors (spread, volatility, time of day) rather than signal delivery speed. This is the expected healthy result and the most common finding for M15+ strategies.
Positive relationship (upward-tilting cluster)
Higher signal delivery latency consistently associates with worse (more negative) slippage. The cluster tilts from lower-left (fast delivery, good fills) to upper-right (slow delivery, bad fills).
What it means: High signal latency combined with high slippage may indicate network or broker issues worth investigating. The two are measured independently — signal delivery and broker execution are separate processes — but when both degrade simultaneously, consider:
- Switching to a closer Strateda server region (US East vs EU Central) to reduce signal delivery time.
- Reviewing whether your broker re-quotes or delays fills during volatile moments.
- Filtering trades during peak volatility when both latency and slippage tend to spike.
Outlier pattern (tight cluster with scattered extreme points)
The main cluster shows no relationship, but a few points with very high latency also have very high slippage. These outliers represent trades during extreme market conditions where both latency and slippage spike simultaneously.
What it means: Normal execution is fine, but exceptional events produce compounding costs. If these outliers are frequent enough to matter, check whether they cluster during specific times (news releases, session opens) using the Temporal Patterns view.
Example
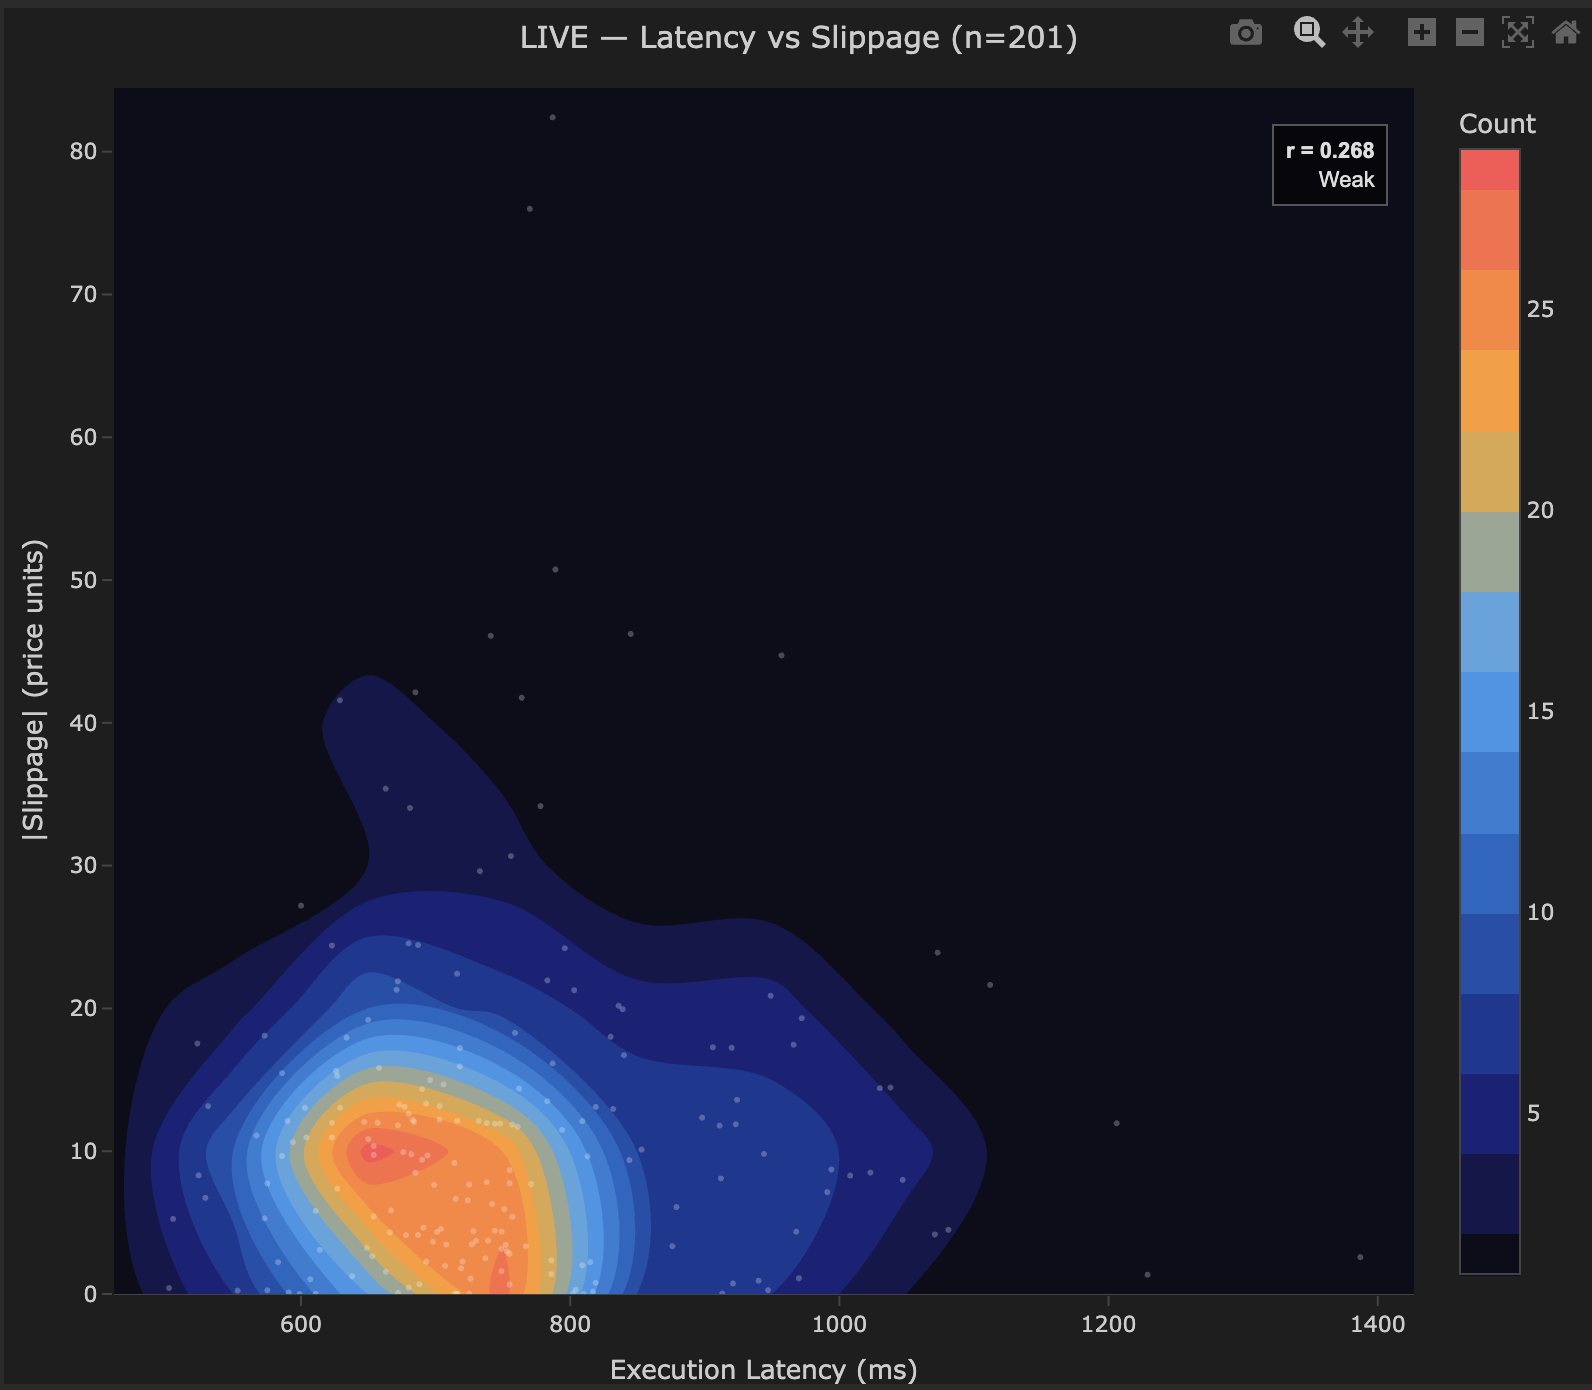
Latency vs slippage density for 201 trades on BTCUSD:
- r = 0.268, Weak — shown in the top right of the chart.
- Main cluster: Concentrated around 600–800ms latency, 0–20 price units absolute slippage.
- Slight upward tilt visible but the weak correlation confirms latency is not a primary slippage driver.
- Scattered outliers at higher latency and slippage — occasional spikes during volatile market conditions.
Interpretation: Signal delivery latency shows only a weak relationship with slippage magnitude. Broker execution quality is the dominant factor. The cluster shape confirms this is a healthy execution profile — no systematic degradation as latency increases.