Live Close Reason
What it is
The Live Close Reason chart shows how your live demo trades ended: closed by the strategy's own exit signal, by a stop loss at the broker, or by a take profit at the broker. Each slice also shows the average profit or loss of the trades that ended that way.
This matters because the exit mix in live demo trading can differ from the backtest. If far more live trades end on a stop loss than you expected, the strategy may be meeting conditions it did not meet in testing, or its stops are tighter than the market's normal movement.
How to access it
Open the LIVE Close Reason tab in the Strategy Analytics popup after loading your live trades. Available on Pro and Premium plans. You must first load your live strategy trades (see Loading Live Trades).
Live analytics are region-scoped: ensure the navbar region matches the region the strategy was started in. See Server Selection.
What you see
A ring chart titled LIVE — Exit Reasons (n=N), where N is the number of closed trades, also shown in the centre. Each slice is one way a trade ended:
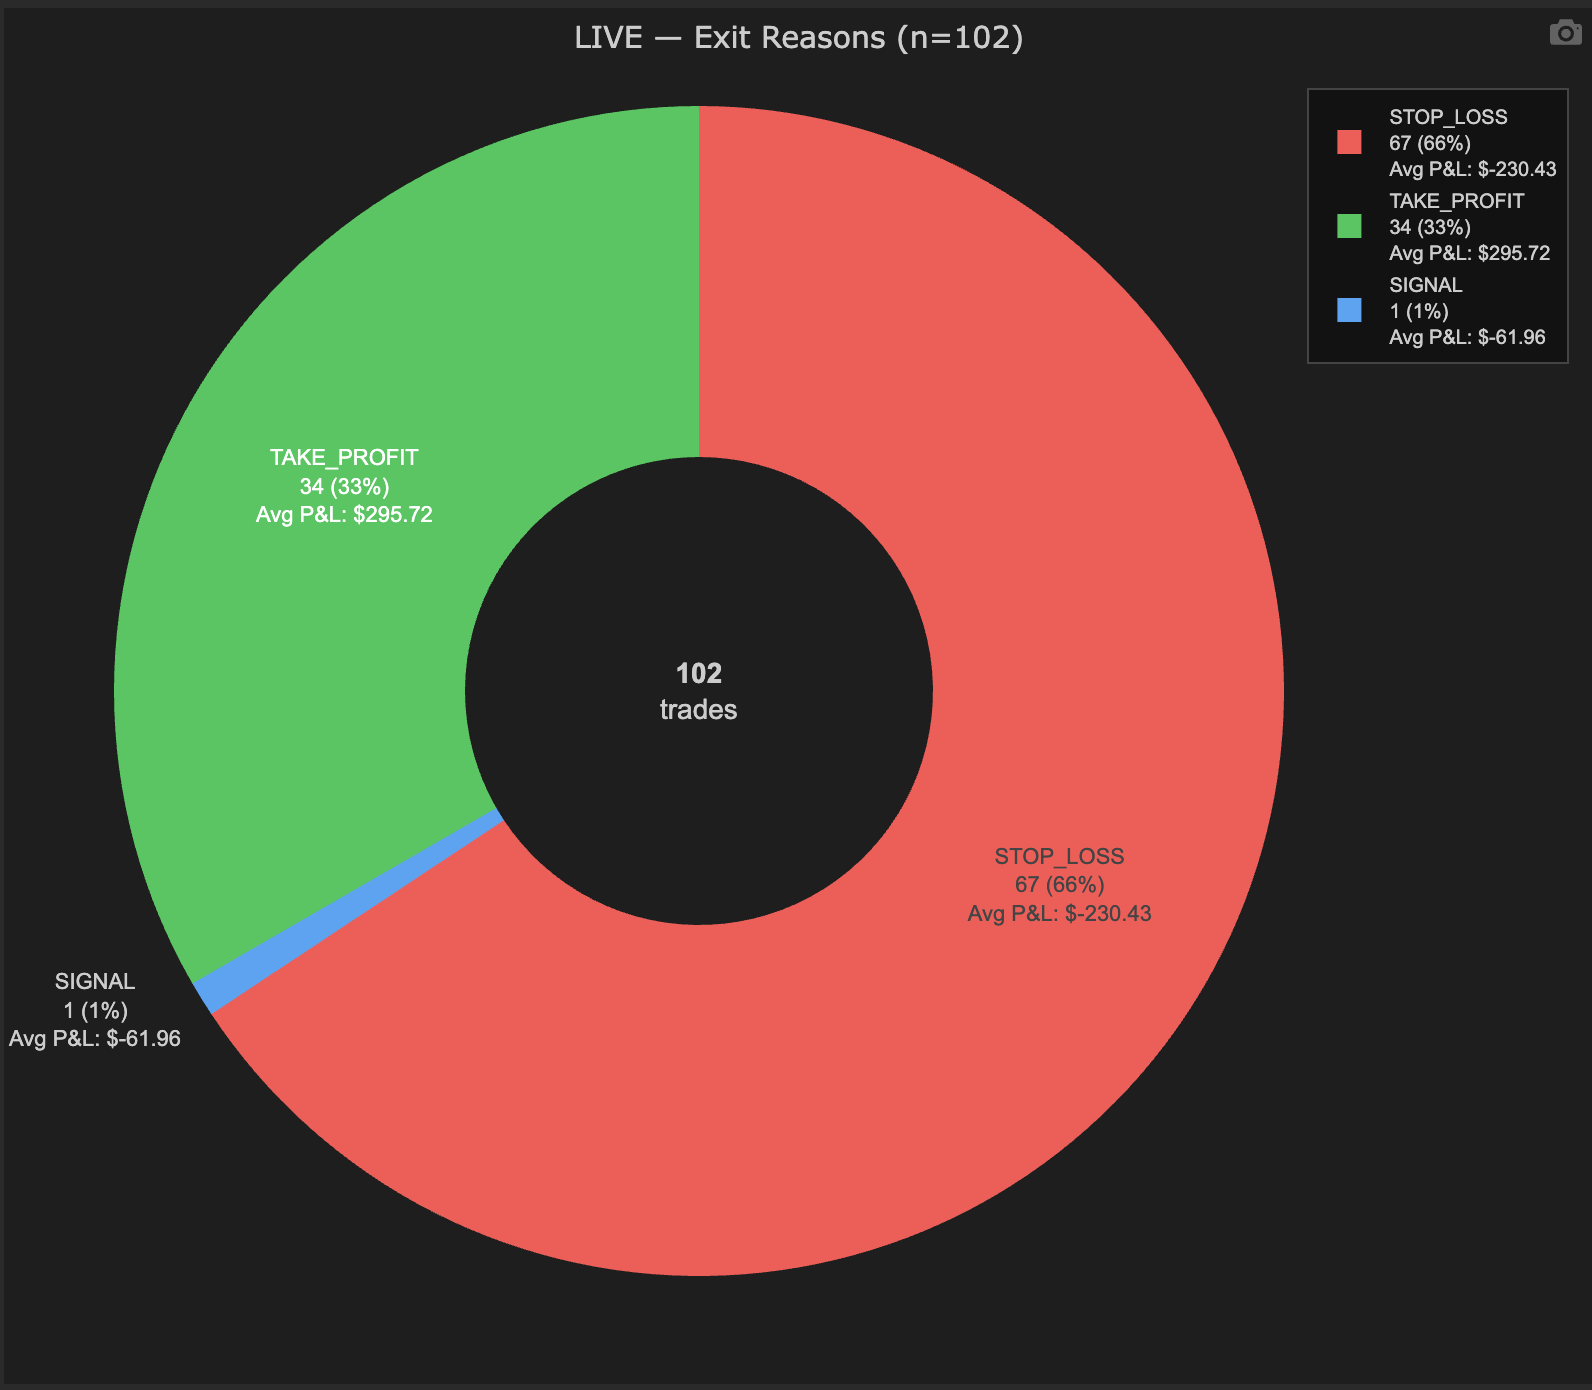
A strategy whose live trades almost all ended at the broker: two thirds on the stop loss, one third on the take profit.
- SIGNAL (blue): the strategy closed the trade itself, through its close signal.
- STOP_LOSS (red): the broker closed the trade at its stop loss. This includes the EA's emergency stop loss, which is placed as an ordinary stop on the order.
- TAKE_PROFIT (green): the broker closed the trade at its take profit.
Each slice is labelled with its count, its share of all closed trades, and the average P&L of those trades.
How to interpret it
Compare the mix with the backtest
Look at the same split in your backtest's trade list. A live mix close to the backtest's means the strategy is exiting the way it was designed to. A large shift is worth investigating before anything else.
Patterns worth noticing
Stop losses much more frequent than in the backtest: live fills, slippage or volatility are hitting stops the backtest did not. Check Slippage Distribution and whether the stop distance is small relative to the instrument's typical spread.
Take profits rarely reached: the target may be too far for the conditions the strategy is trading in now, so most trades end on the signal or the stop instead.
Signal exits with a negative average P&L: the exit logic is closing trades that are, on average, losing. That is not wrong in itself (exiting early can cap losses), but it is worth comparing with the backtest's signal-exit average.
Small samples
With only a few dozen closed trades, one or two trades can move a slice by several percentage points. Read the counts, not only the percentages, before drawing a conclusion.
Example
A GBPJPY M15 strategy has 60 closed live trades: 41 SIGNAL with an average of +$4.10, 17 STOP_LOSS averaging −$11.80, and 2 TAKE_PROFIT averaging +$18.50. In the backtest, about 15% of trades ended on a stop loss; live, it is 28%.
The signal exits are behaving as tested, but stops are being hit almost twice as often. The next step is to check the execution-quality views for slippage on stop exits, and to re-run the backtest over the live period to see whether the market itself was more volatile than in the test window.