Live Per-Trade Exposure
What it is
Per-Trade Exposure shows the total market value of your open position for each trade over time — the actual dollar amount at risk, not just margin. For leveraged instruments like BTCUSD, exposure is significantly larger than margin. A trade requiring 50,000 of market exposure. This chart makes that reality visible.
Monitoring exposure over time reveals whether your position sizing is stable or drifting as your account balance changes. With percentage-of-balance sizing, exposure naturally scales with your account — growing as you win and shrinking as you lose. Understanding this dynamic is essential for managing risk as your strategy runs.
How to access it
Navigate to Per-Trade Exposure in the live strategy analytics panel after loading your live trades. Available on Pro and Premium plans. You must first load your live strategy trades (see Loading Live Trades).
Live analytics are region-scoped — ensure the navbar region matches the region the strategy was started in. See Server Selection.
What you see
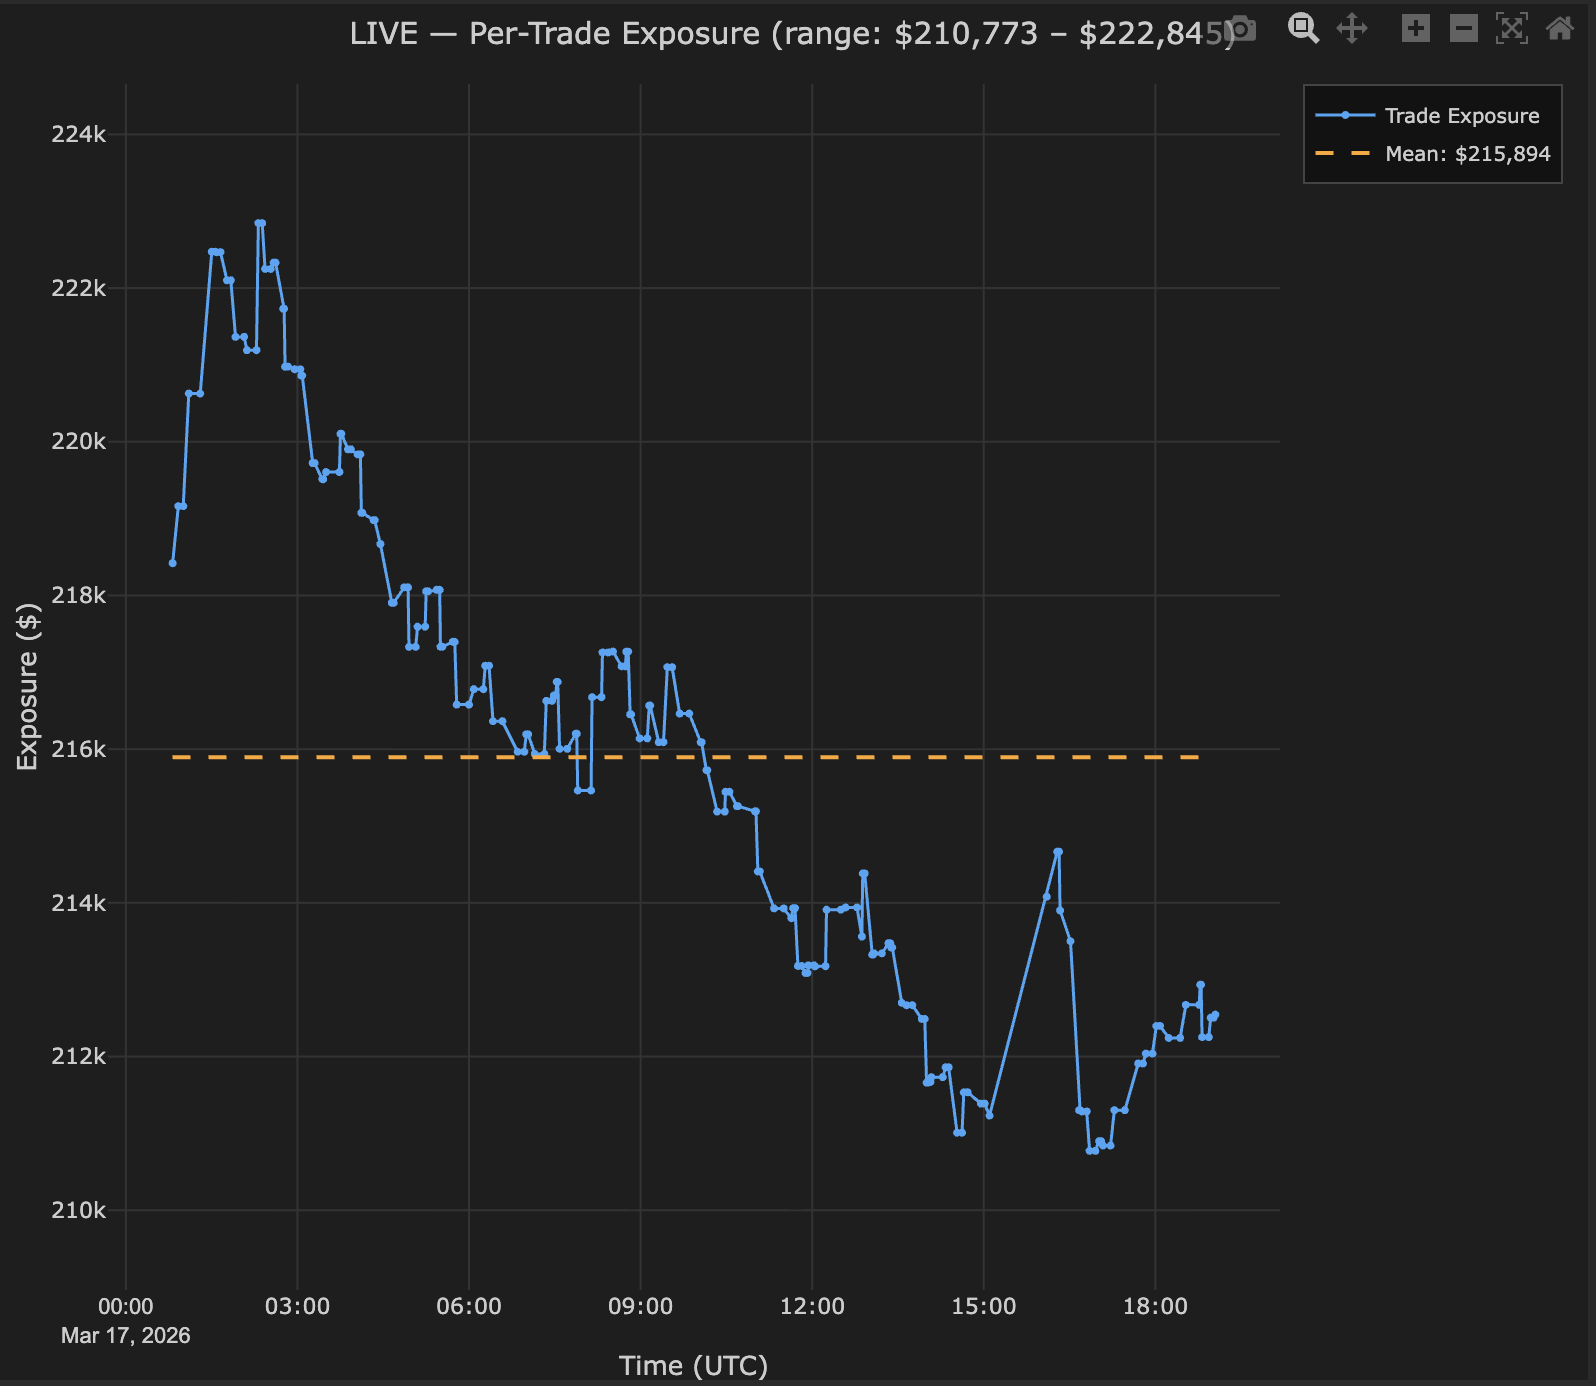
- X-axis — Time (UTC) — trades displayed in chronological order.
- Y-axis — Exposure ($) — total position value at trade open, in account currency.
- Blue line — Trade Exposure per trade, connecting each trade's total market value.
- Orange dashed line — Mean exposure across all loaded trades, providing a baseline for comparison.
- Title — Shows the range: min–max exposure values across the loaded period.
How to interpret it
Exposure patterns
Since Strateda sizes positions as a percentage of your current account balance, exposure will naturally fluctuate with your balance over time. A gradually drifting line is the expected pattern — not a flat line.
Gradual drift upward: Expected — strategy is profitable, balance growing, each trade's exposure scales up proportionally
Gradual drift downward: Expected — strategy in drawdown, balance declining, each trade's exposure scales down proportionally — percentage-based sizing provides natural risk reduction during losing periods.
Sharp spikes: Unusual price action at trade open causing larger than normal exposure. This can happen when a trade opens during a gap or when the instrument's price is at an extreme relative to its recent range. Investigate whether spike trades correspond to higher slippage or unusual market conditions.
Leverage awareness
Compare the mean exposure line to your account balance to understand your effective leverage per trade:
- Mean exposure 10,000 account → 0.5× leverage per trade — conservative.
- Mean exposure 10,000 account → 2.5× leverage per trade — moderate.
- Mean exposure 10,000 account → 10× leverage per trade — aggressive, ensure your risk management is calibrated.
The exposure chart shows the actual leverage you are running, which may differ from the leverage your broker offers. A broker offering 100:1 does not mean your strategy uses 100:1 — it depends on your PosSize % setting.
Example
Per-Trade Exposure for a BTCUSD live strategy over 3 months:
- Mean exposure: $48,200 (orange dashed line).
- Range: 55,800 (shown in title).
- Pattern: Gradual upward drift from ~54,000 over the period.
- Account balance: Started at 11,400.
Interpretation: The upward drift is consistent with a growing account — exposure scales proportionally with balance. Mean exposure of 10,000 starting balance represents roughly 4.8× effective leverage per trade. The range is tight (±13% around the mean), confirming stable position sizing with no spikes or anomalies. As the account continues to grow, the trader may want to review whether the absolute exposure level remains within their risk tolerance.